Berlitz Canada · 2024–2026
Thirty-nine pages that name the city and the language, and the paid search that fills them.
Berlitz Canada’s paid acquisition, from the Google Ads account to the page the click lands on: ten city campaigns, 39 city and language landing pages in English and French, the Salesforce lead flow and a monthly report that ties spend to enrolments. September 2026 was the highest-volume month on record, with the cost of a qualified lead down 42% in a year.
The challenge
A national home page can only say so much to someone who searched for French classes in Winnipeg. They have to find Winnipeg, find French and find the form, and some of them leave before doing all three. Paid search pays per click, so every one of those exits has a price.
The fix is a page per intent, but Berlitz Canada sells four languages in ten cities to several kinds of learner. That is dozens of pages, each needing a French twin, and there was no budget for dozens of design jobs.
Behind the pages sat an ad account that nobody could read end to end: spend spread across campaigns, no path from click to enrolment, and a Salesforce flow the reports could not see.
The approach
Nothing moved until the tracking was honest. We tagged every touchpoint, rebuilt the GA4 event taxonomy and connected Google Ads to Salesforce through a custom lead capture layer, which finally showed the path from click to enrolment.
Only then the media. Search was rebuilt city by city: ten campaigns, one for each Learning Centre market and its language mix, from Montréal and Toronto to Ottawa, Calgary, Vancouver and Edmonton, each with its own budget and target cost per acquisition. The spend that could not be measured was paused. Ad copy was rewritten around professional language training rather than generic learning. The landing pages are part of the engagement, so the account is read page by page: in autumn 2026 the city-and-language pages produced 84% of non-brand leads and 88% of qualified leads, at a lower cost per qualified lead than the generic pages, so every non-brand campaign now lands on them. On Meta, each seasonal moment gets its own campaign: a September back-to-learning lead campaign, Black Friday, a May and June last-chance offer and the Sketches Between Lines video series, with 17 creatives in English and French across offer, persona and video formats. A monthly report to the client carries leads, qualified leads, enrolments and revenue, month against the same month a year earlier.
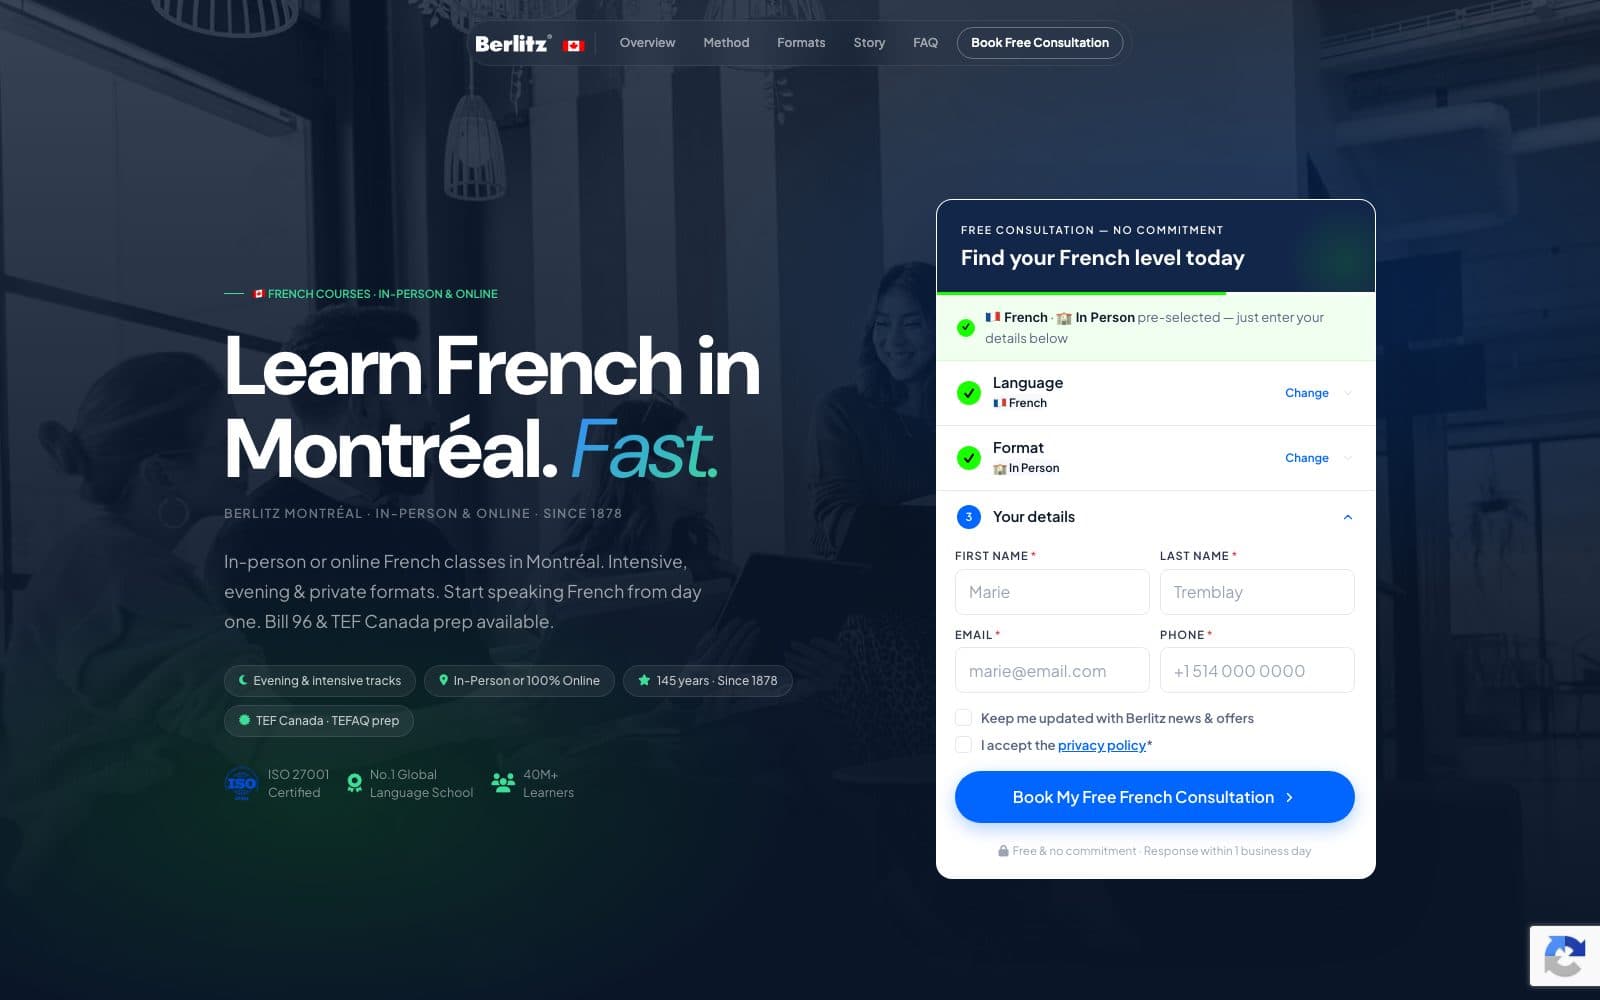
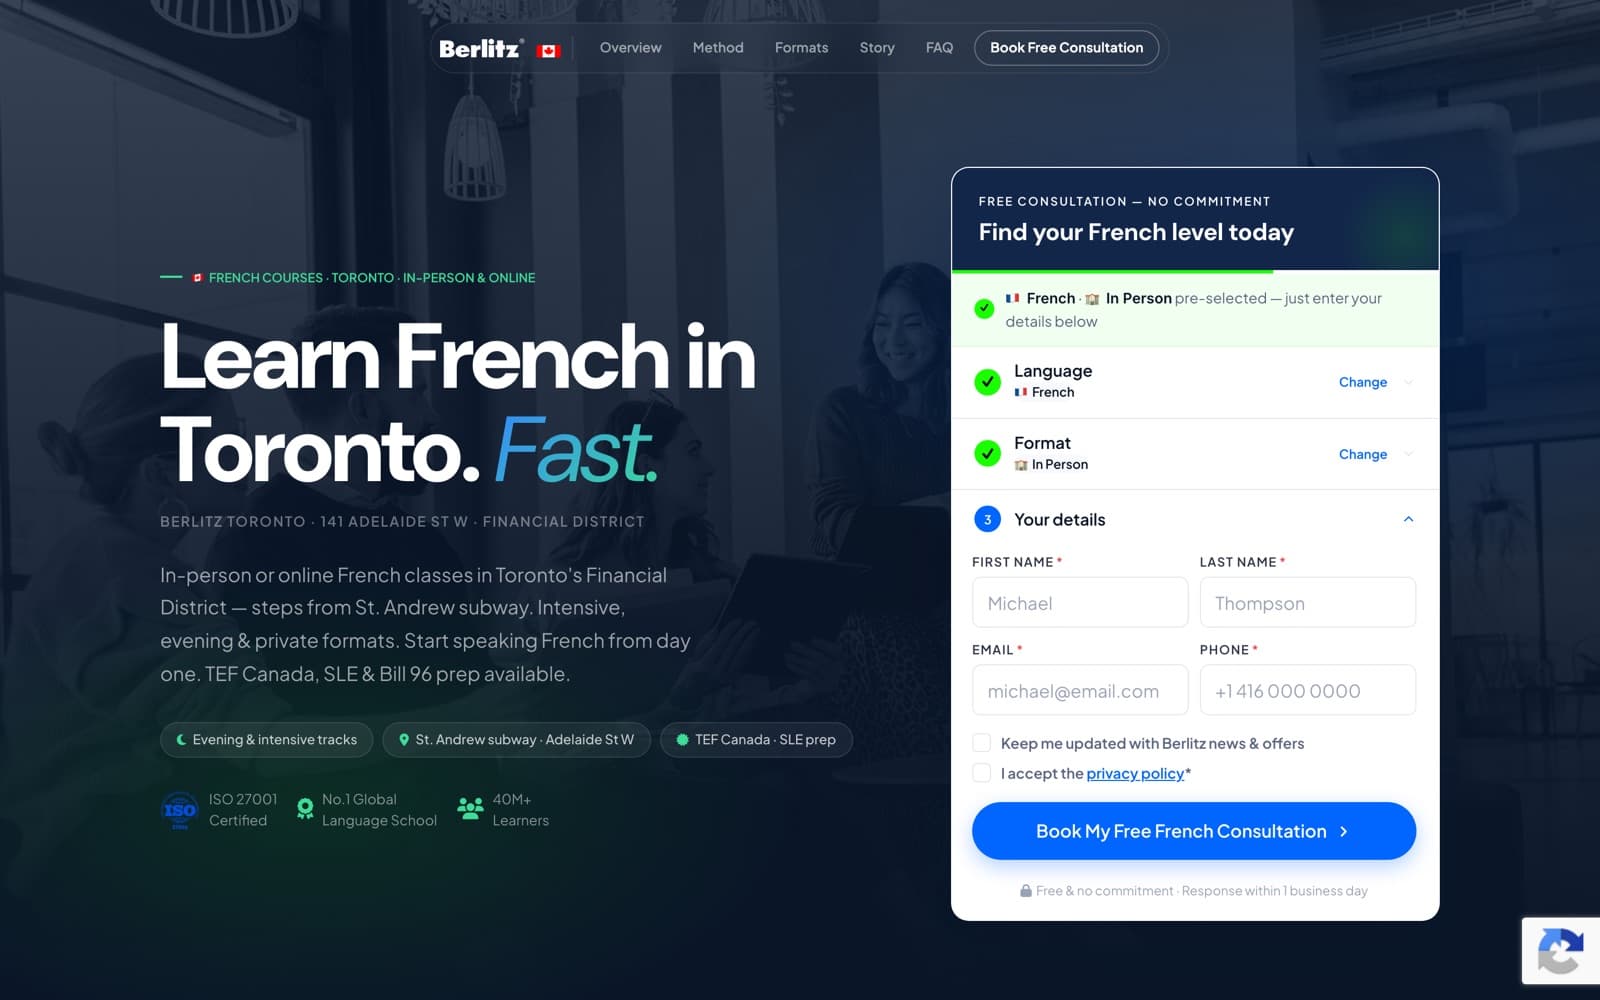
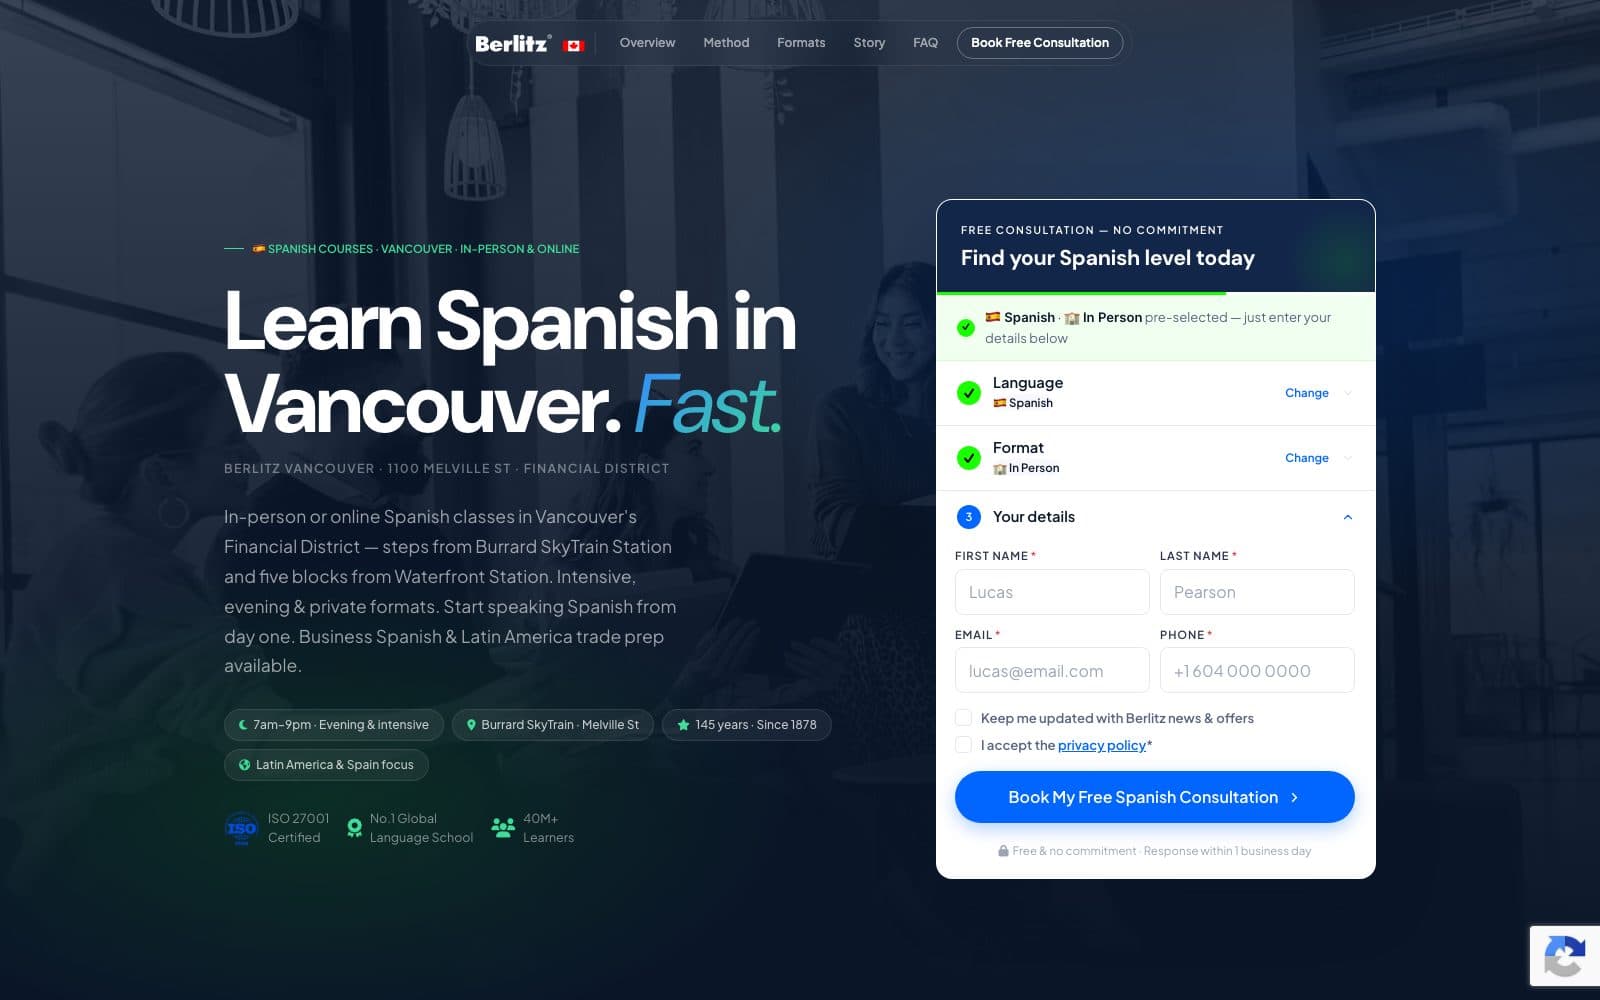
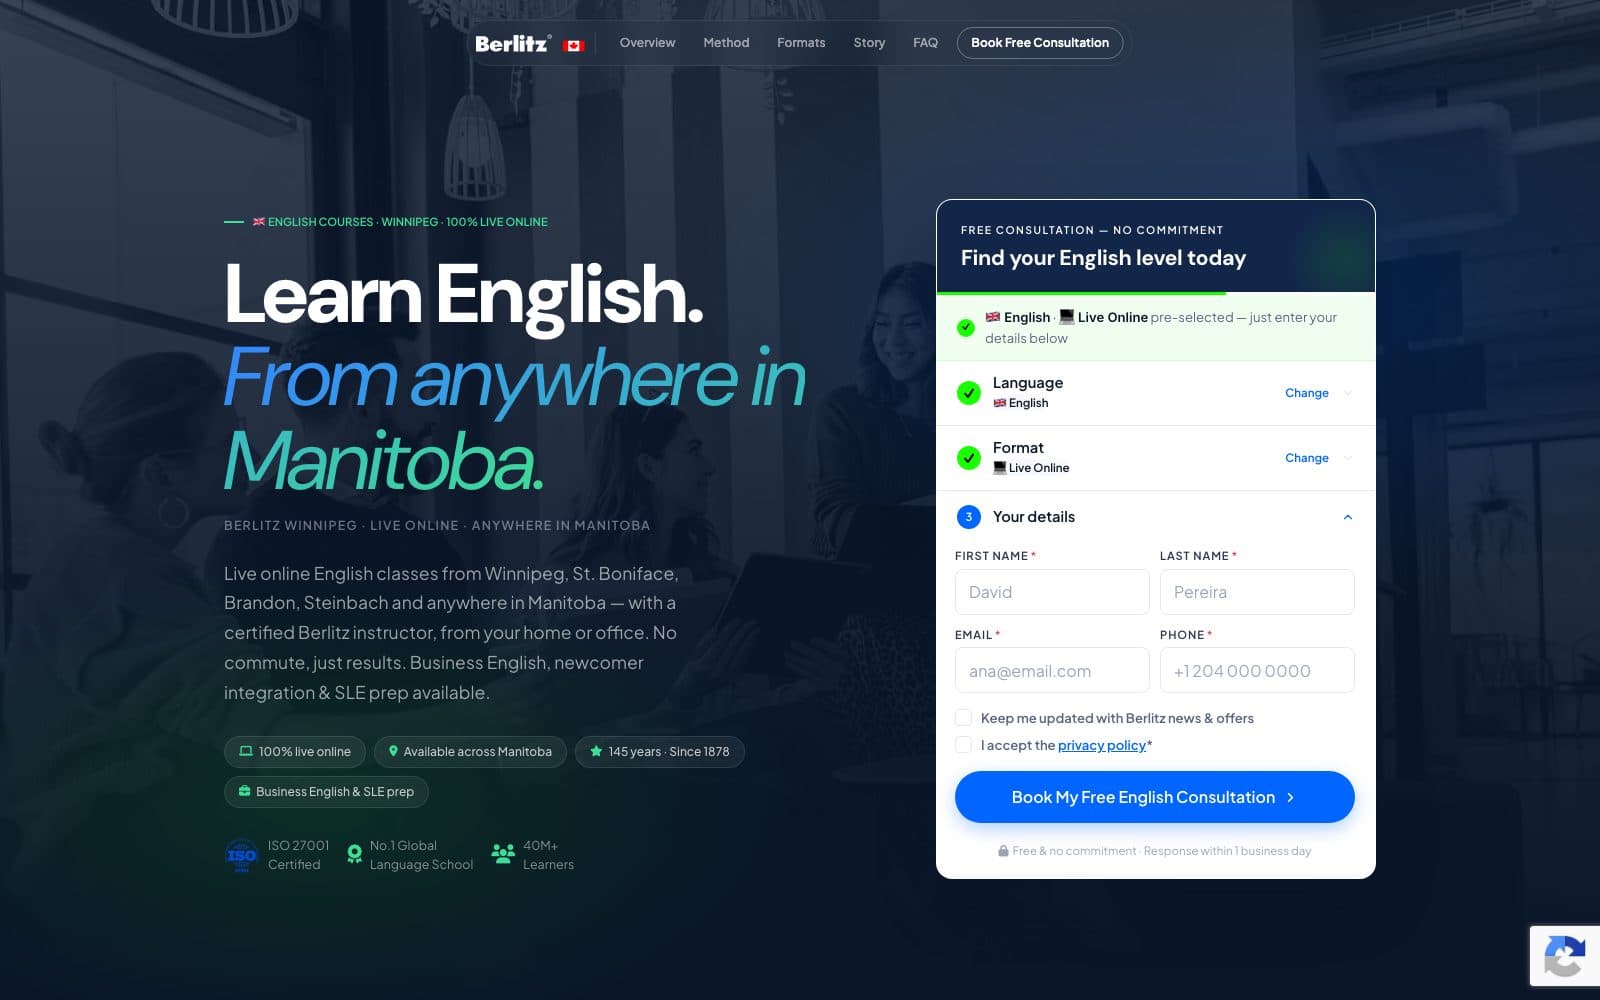
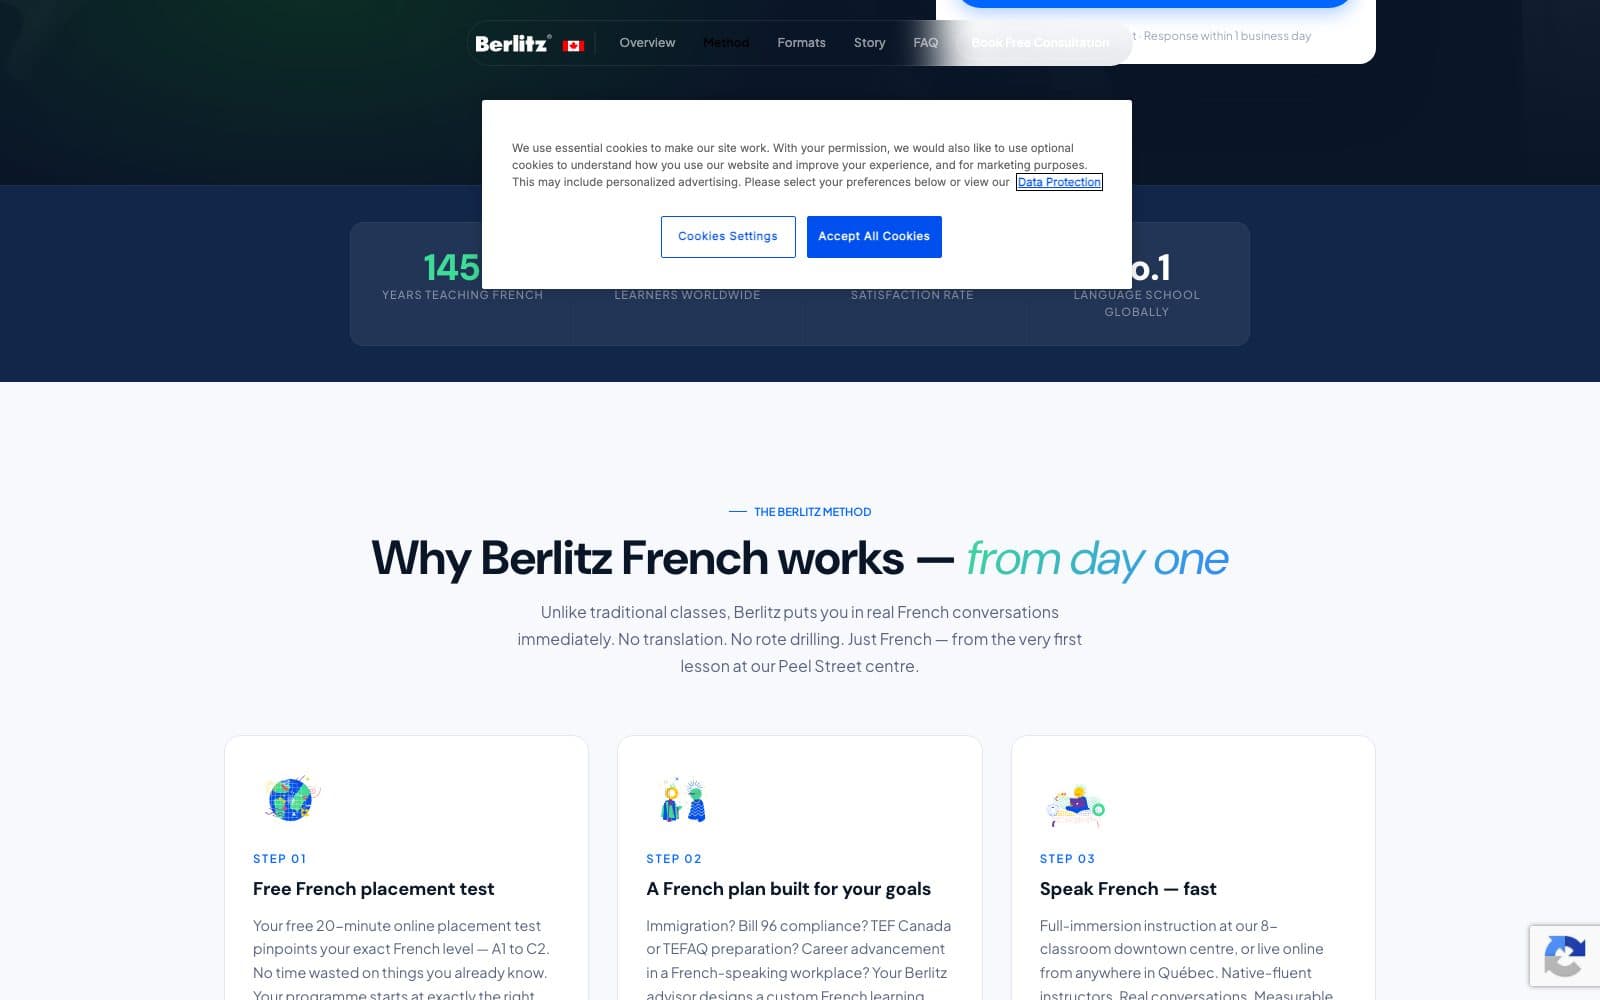
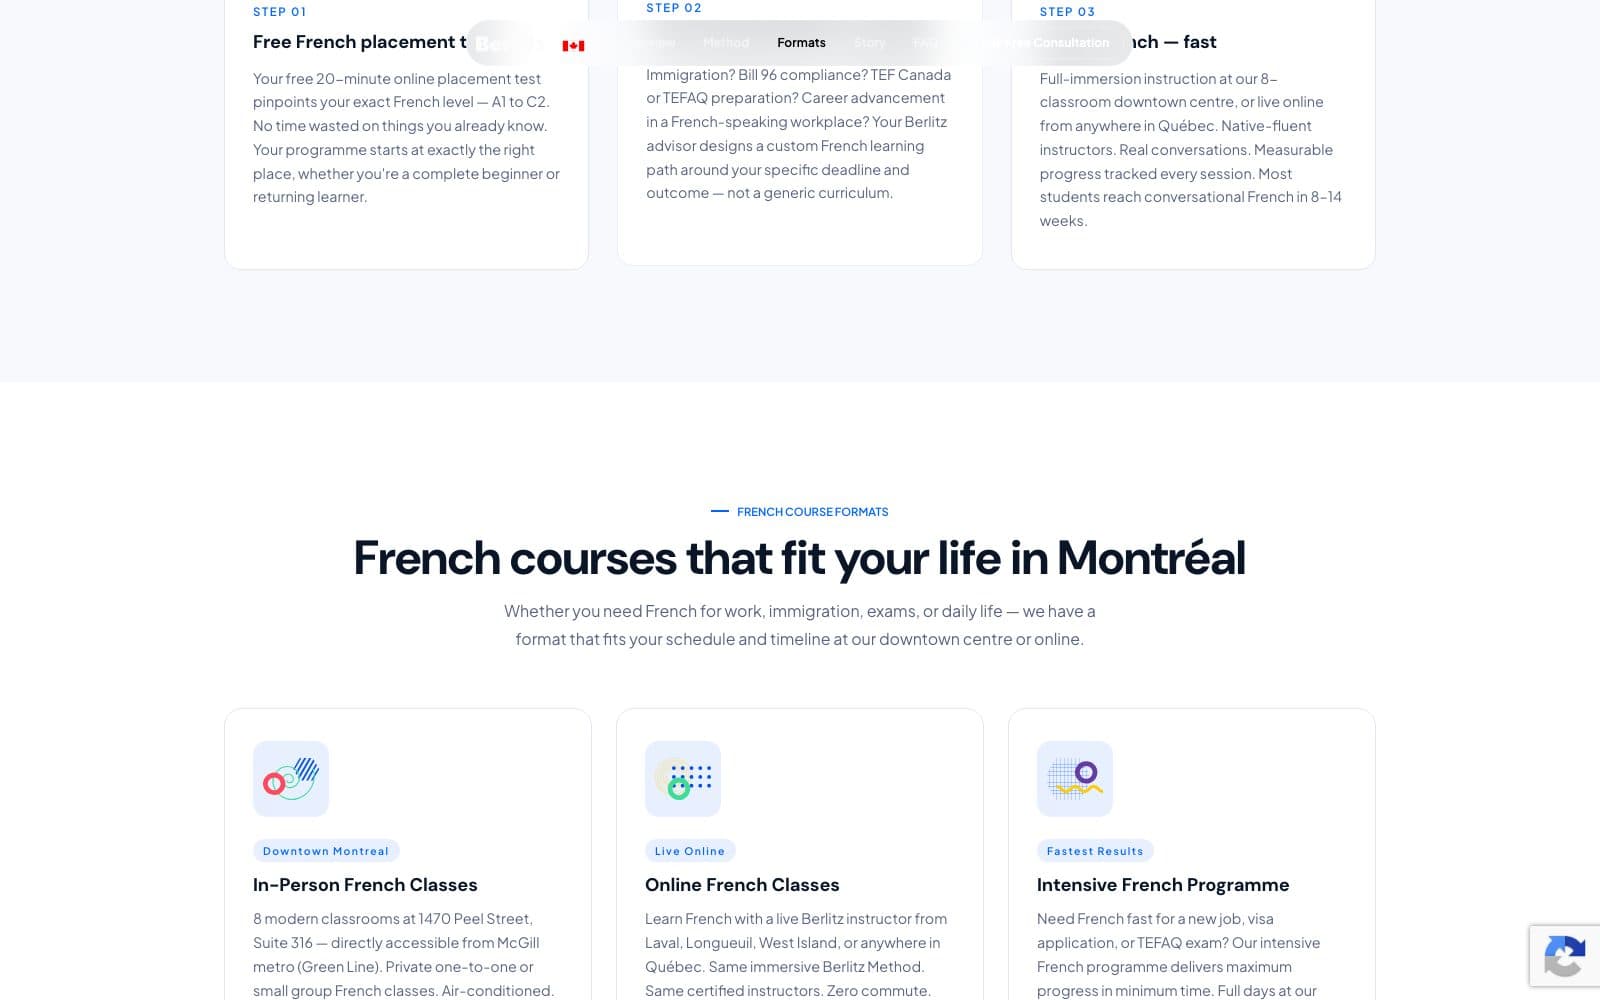
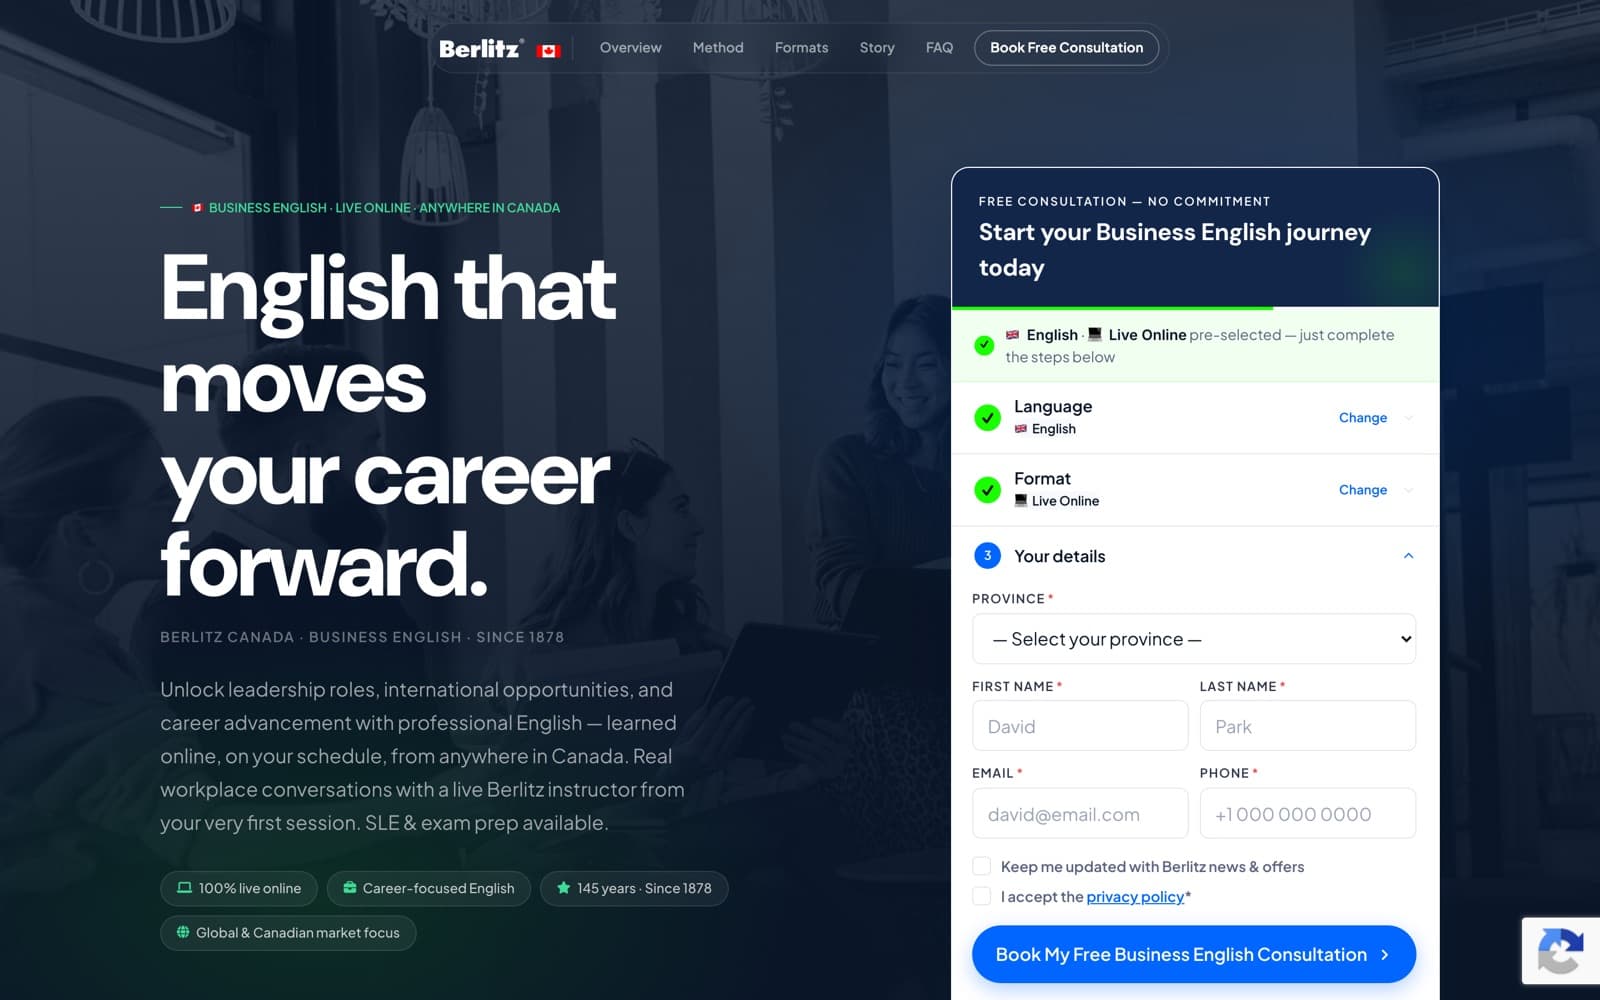
One template, built once, that produces a page per city and language rather than a page per request. The headline names the city and the language. The address, the nearest transit stop, the formats and the questions are the centre's own. The form opens with the language and the format already selected to match the page, so the first thing a visitor is asked for is their name.
Thirty-nine pages cover the city and language combinations: French, English, Spanish and Portuguese across Montréal, Greater Montréal, Toronto, the GTA, Ottawa, Vancouver, Calgary, Edmonton, Winnipeg and Victoria. Eleven more cover a segment rather than a place: business English, business French, French for government, French for permanent residency, online classes and the self-paced Flex programme.
Every page publishes at its own URL and at a French twin from the same source, so the two cannot drift apart. Adding a city or a language is a content job now, not a design job, which is why the set reached fifty without the marketing team booking build time. Salesforce takes the lead and routes it, and Google Tag Manager carries the measurement.
- 01
Audit and tag
Full-funnel audit: GA4 taxonomy rebuild, UTM hygiene, Salesforce lead flow mapping. Two weeks, no media spend.
- 02
One campaign per city
Ten city campaigns, each matched to its Learning Centre market and language mix, with its own budget and target cost per acquisition. Unmeasurable spend paused.
- 03
Read the pages as well as the ads
Leads and qualified leads broken down by landing page every month. Non-brand traffic routed to the pages that qualify, promo offers embedded in them.
- 04
Test and report
Ad copy and landing page tests on a monthly cycle, and one report that puts spend, leads, qualified leads, enrolments and revenue next to the same month a year earlier.
The work
The results
September 2026, against September 2025
+71%
Lead growth, 469 to 804
+153%
Qualified lead growth, 83 to 210
-42%
Cost per qualified lead, $136.71 to $78.98
3.4×
Closed-won revenue against ad spend, third quarter
Bars are indexed: the year before = 100.
The pages did what they were built for. In the September 2026 analysis of the Google Ads account, the city and language pages took 84% of non-brand leads and 88% of qualified leads, at $99 per qualified lead; the generic pages qualified at $139 to $210. All non-brand traffic now routes to the city and language pages, with the seasonal offer embedded in them.
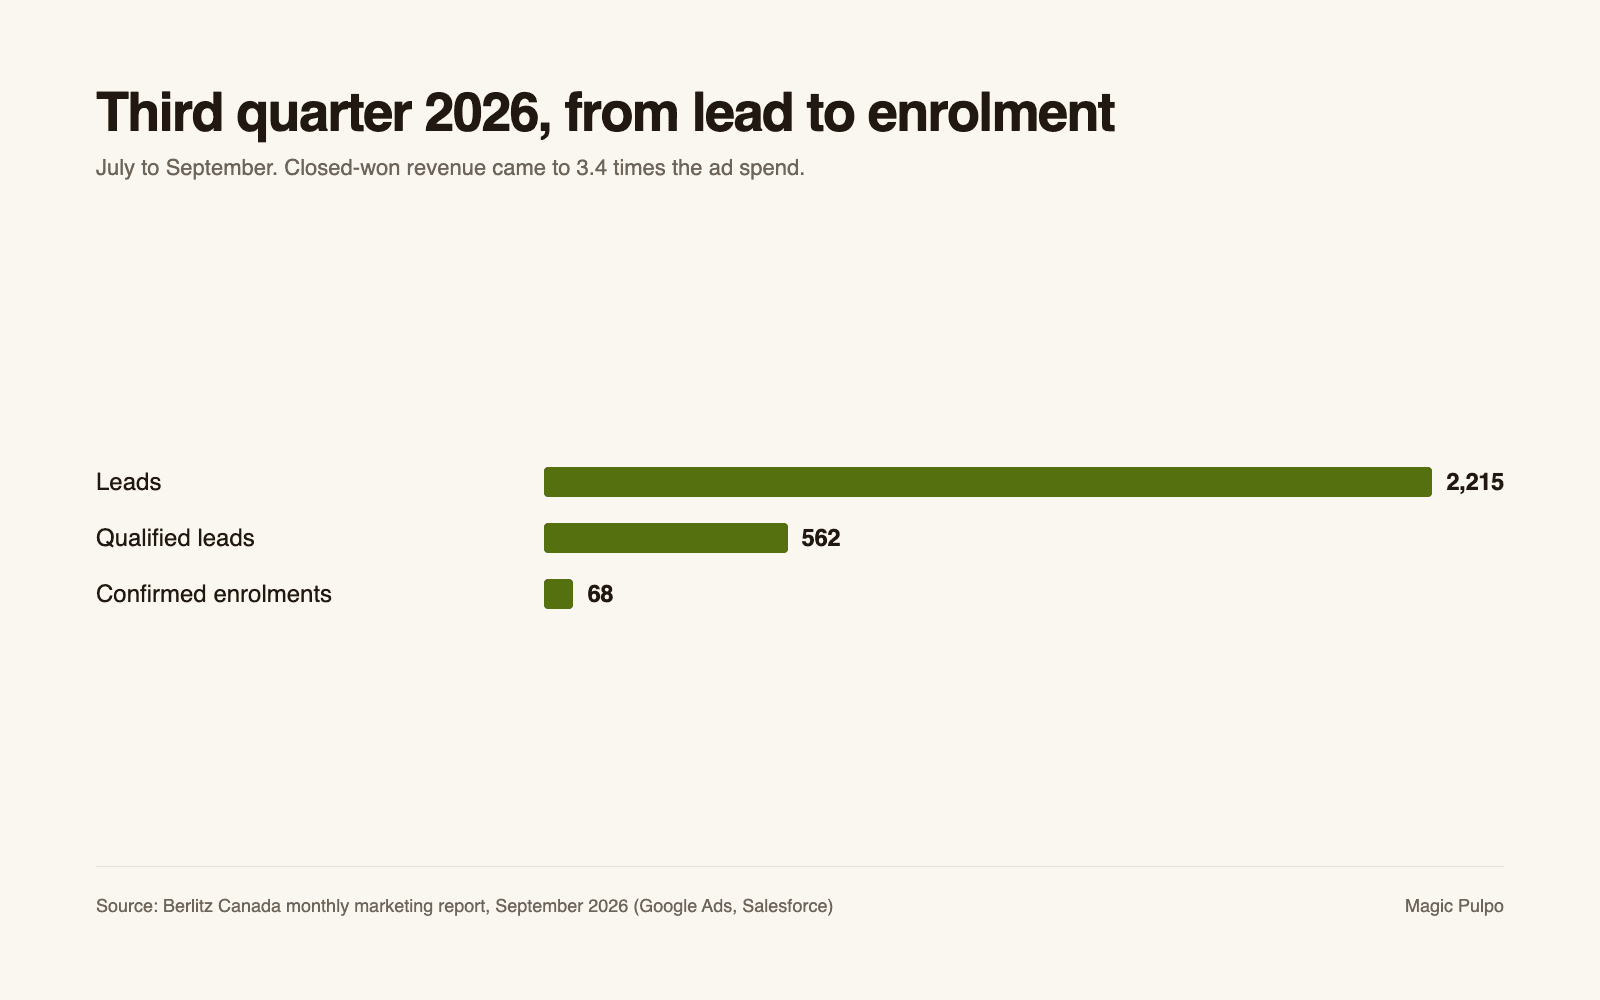
September 2026 was the highest-volume month on record: 804 leads at $20.64 each, 71% more than September 2025 at 15% lower cost per lead. Qualified leads rose from 83 to 210, and the cost of a qualified lead fell 42%, from $136.71 to $78.98. Across July to September, 2,215 leads and 562 qualified leads produced 68 confirmed enrolments, and closed-won revenue came to 3.4 times the ad spend.
Search is strongest where Berlitz has its biggest centres: over the last twelve months the four Montréal campaigns drew 14,221 clicks, Toronto and the GTA 6,442, Ottawa 4,375 and Calgary 3,774. On Meta, four seasonal campaigns reached 85,815 people, and 92% of their 3,678 link clicks landed on the page. The September lead campaign brought 28 leads in eight days, and the May and June “Still thinking” ad held a 3.61% click-through rate.
Figures are from the September 2026 monthly report to Berlitz Canada, read from the Google Ads account and Salesforce, and from the Google Ads and Meta ad accounts on 16 October 2026.
Fifty pages are live, 39 of them a city and language combination, all in both official languages. Measured on a mobile profile in September 2026, Cumulative Layout Shift was 0.000 on every page checked and median full load 0.79 seconds.
Search clicks by city, last twelve months
| Channel | clicks | Spend |
|---|---|---|
| Montréal and Greater Montréal | 14,221 clicks | 4 campaigns |
| Toronto and the GTA | 6,442 clicks | |
| Ottawa, French and English | 4,375 clicks | |
| Calgary | 3,774 clicks |
What we delivered
- Full-funnel analytics architecture (GA4 + Salesforce)
- Ten city campaigns with per-campaign target CPA
- Landing-page level lead and qualification reporting
- Four seasonal Meta campaigns and 17 creatives in English and French
- Salesforce STAR lead integration
- Monthly marketing report: paid, SEO, social and email in one deck
- Cities: Montréal, Greater Montréal, Toronto, the GTA, Ottawa, Vancouver, Calgary, Edmonton, Winnipeg, Victoria
- Languages: French, English, Spanish, Portuguese
- Segments: business English, business French, French for government, French for permanent residency
- Formats: online classes and the self-paced Flex programme
- A form with language and format already selected to match the page
- A French twin for every page, published from one source
What it runs on
Webflow
One template, fifty pages, marketing publishes without engineering
Webflow Localization
A French twin of every page from one source
Salesforce
Lead capture and routing on every form
Google Tag Manager
Measurement across the set
reCAPTCHA
Form protection
Related projects
All work

We apply the same thinking to every engagement.
Book a 30-minute strategy call. We'll look at your challenge and say whether we're the team for it.