Magic Pulpo Studio · 2026
The client tracker we retired became the starter every dashboard begins from.
A config-driven KPI dashboard starter, generalised from a tracker we built for Berlitz Canada and then deliberately retired when a self-contained Excel workbook served the client better. The engineering survived as an open starting point for every dashboard we build.
The challenge
Where it came from
We built a KPI tracker for Berlitz Canada: eight KPIs from enrollments to CAC, sliced by segment, centre and period, fed by importers that parse the client's real, messy spreadsheets and thousands of rows of Google Ads spend.
The approach
Why we retired it
The honest answer was that the client's team lives in Excel. So we sunset the app, mirrored every formula into a self-contained workbook they own, and generalised the engineering into this starter, with no client data carried over.
The reconciliation rule
The starter's core opinion: funnel numbers must reconcile with financial numbers per month and per location, and a variance over 5% flags red on the dashboard itself. When it flags, you fix the source of truth.
About these charts
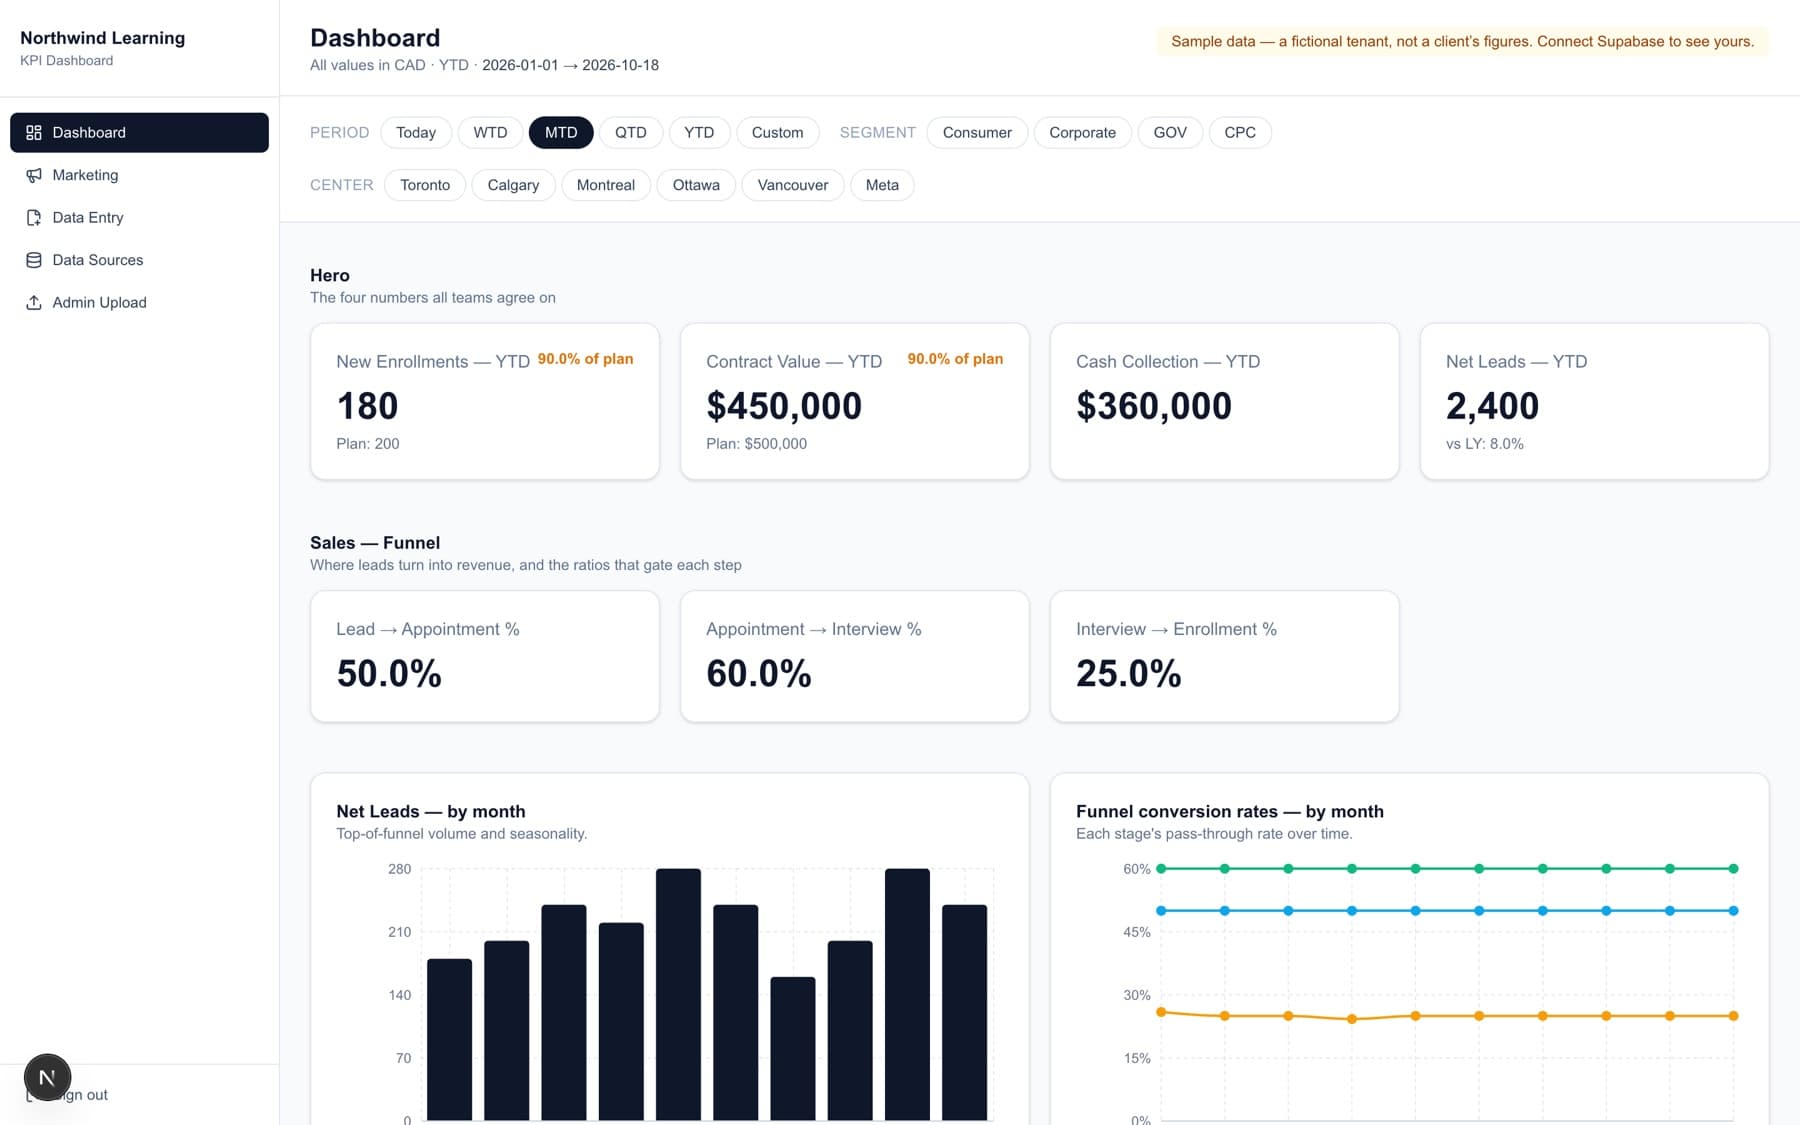
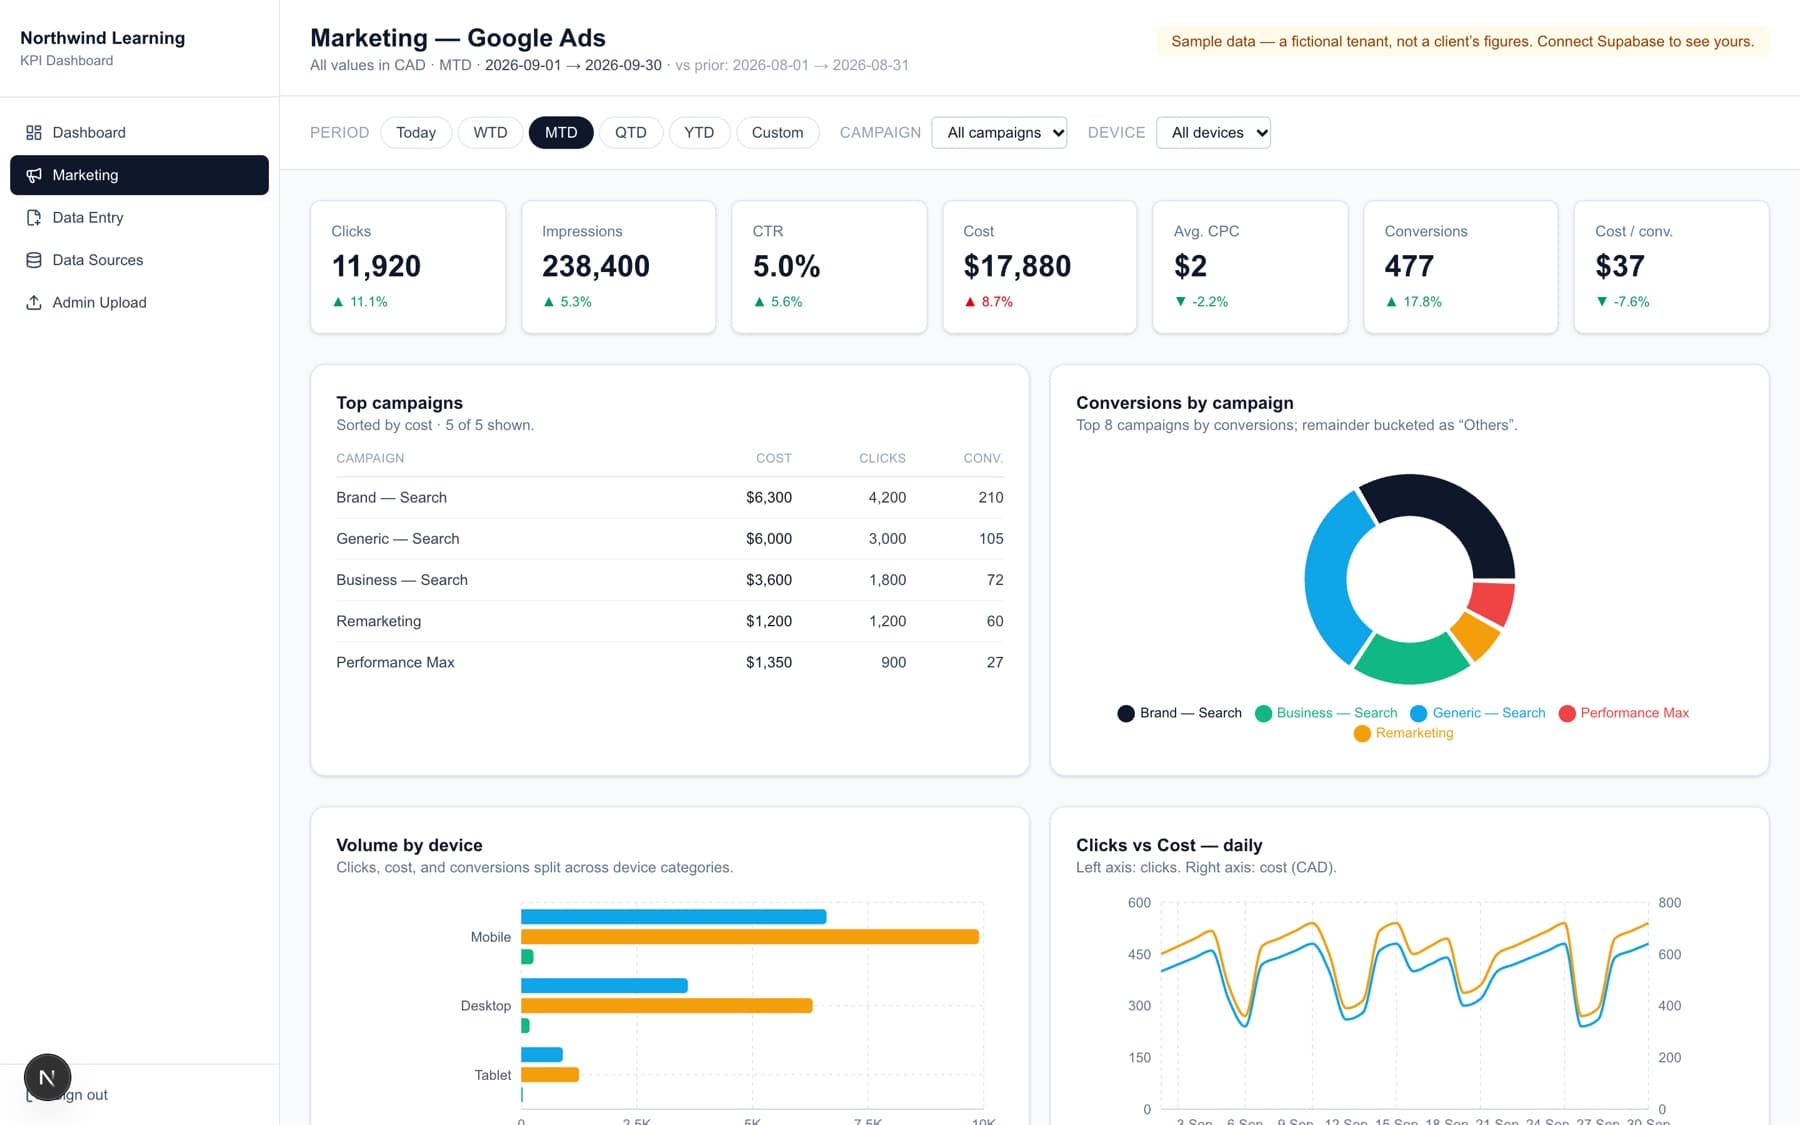
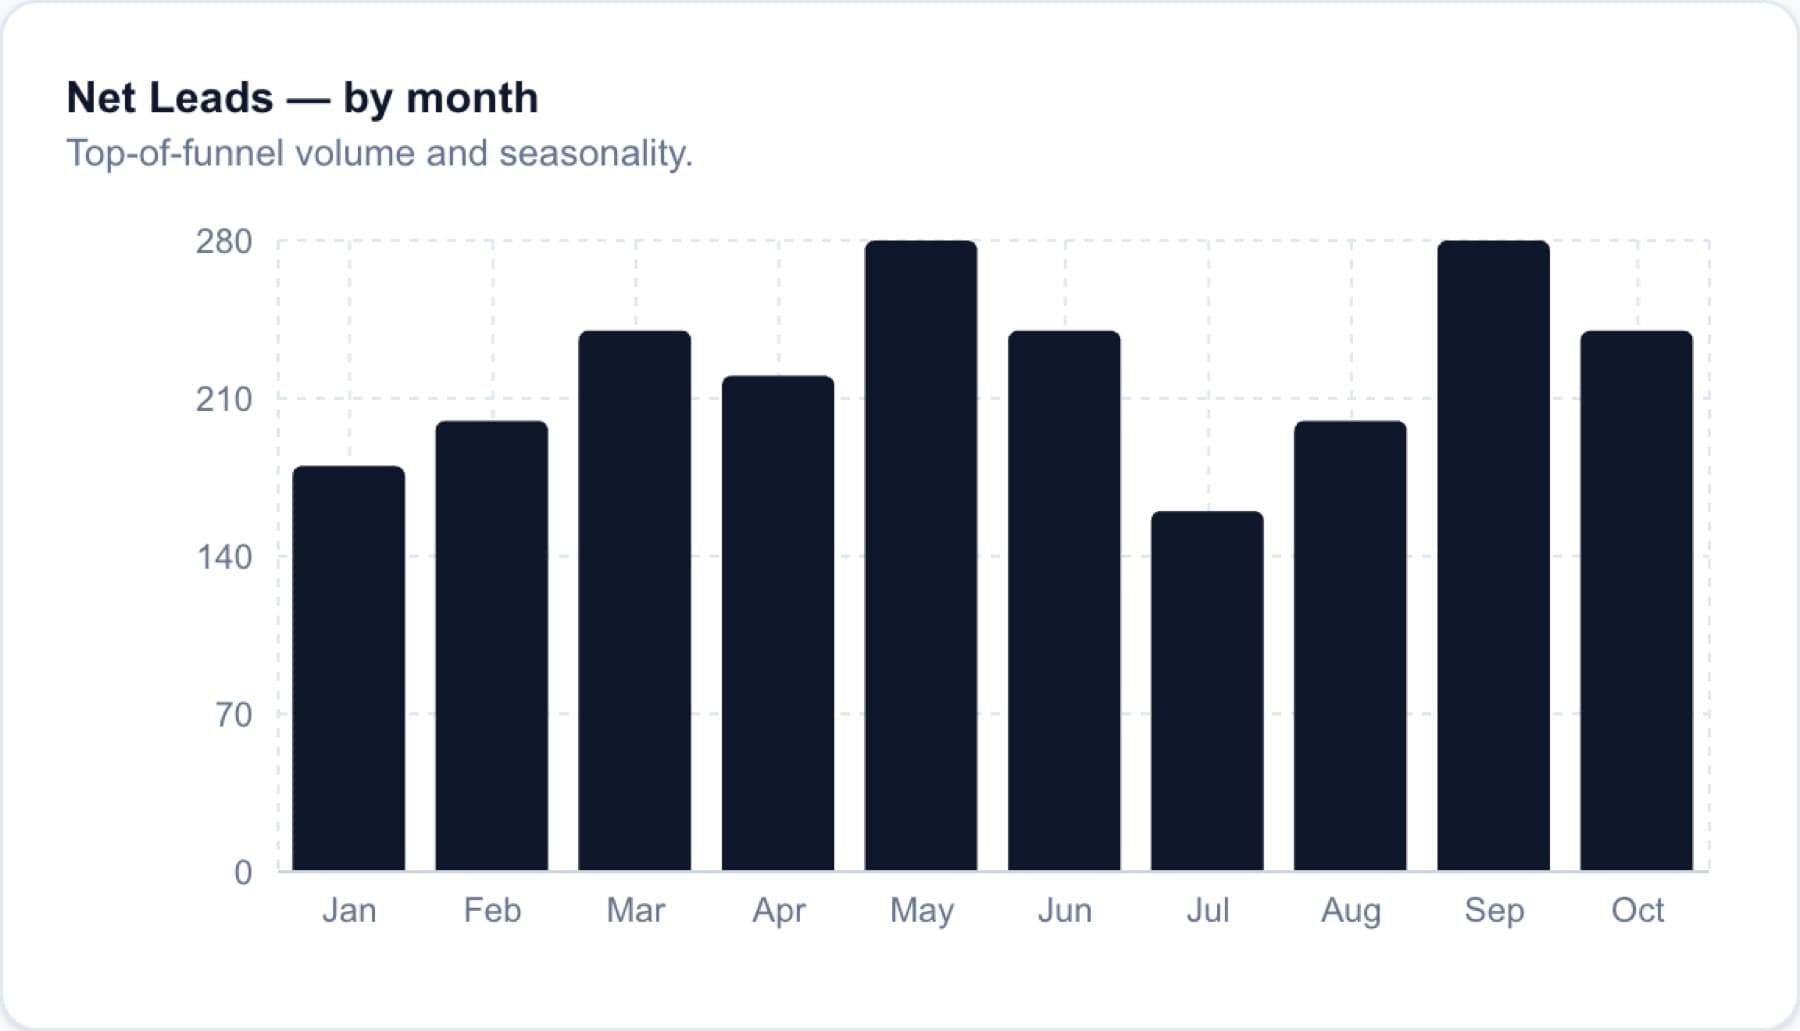
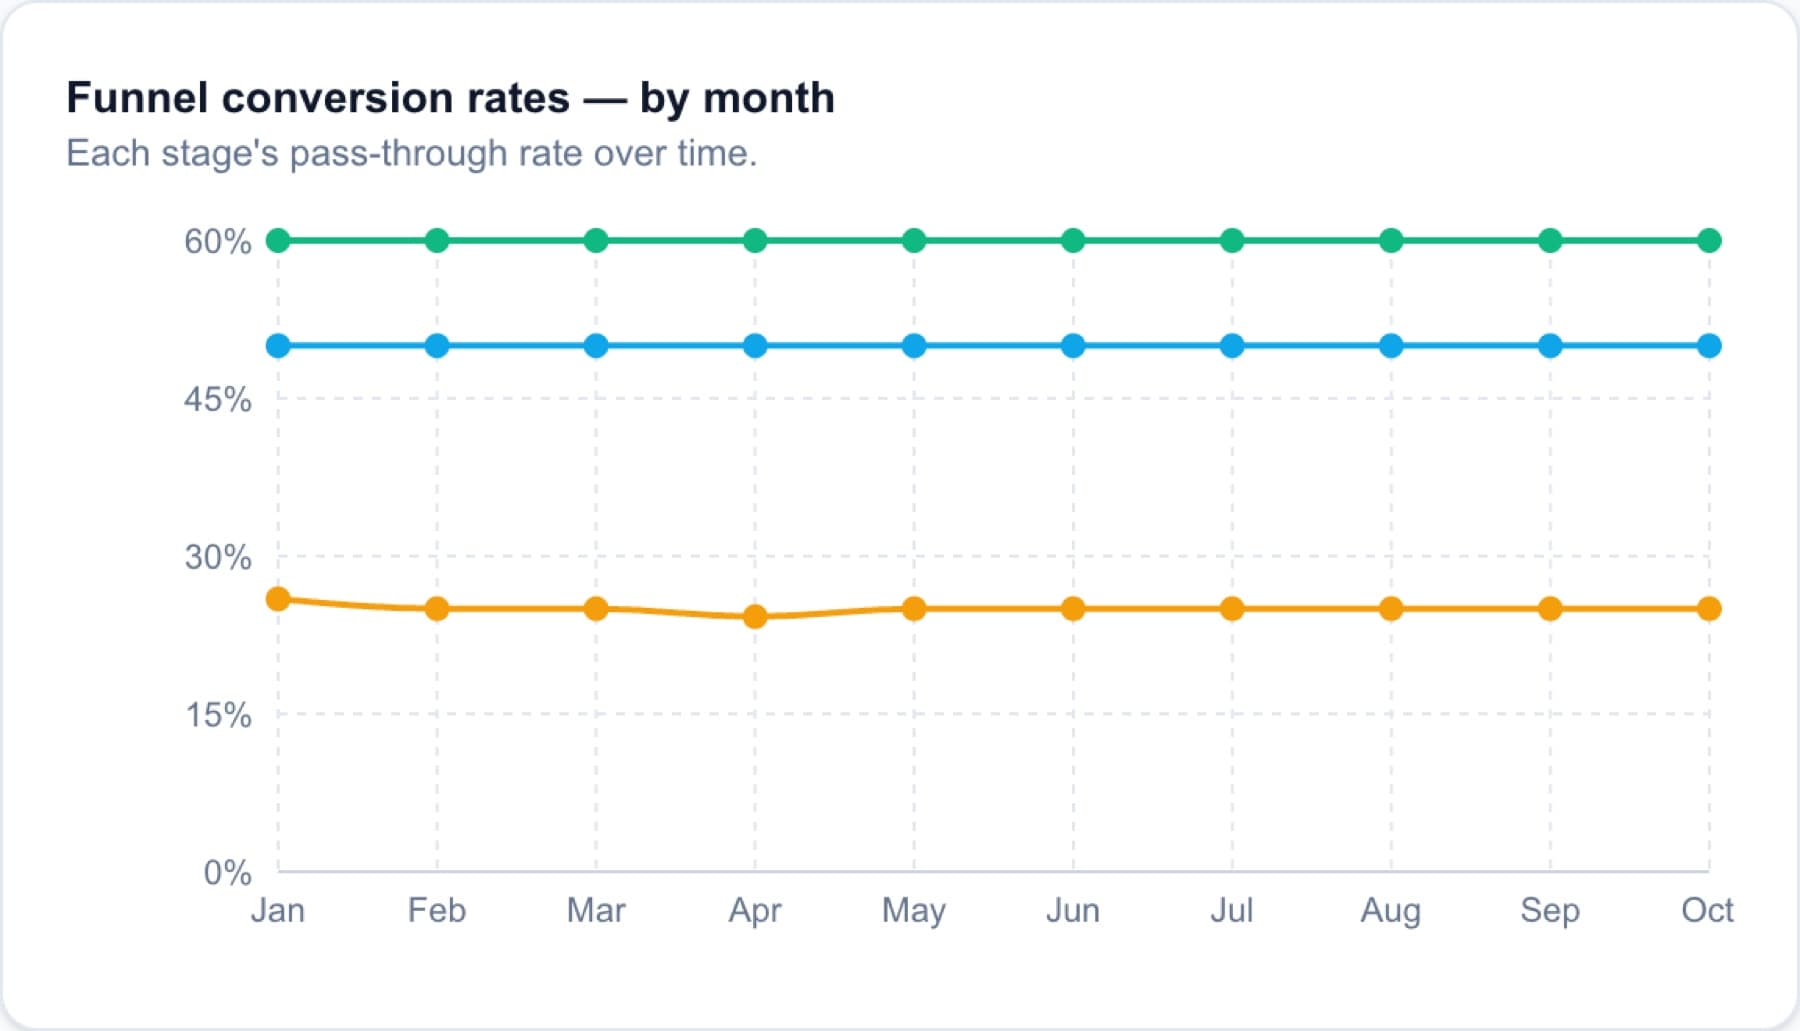
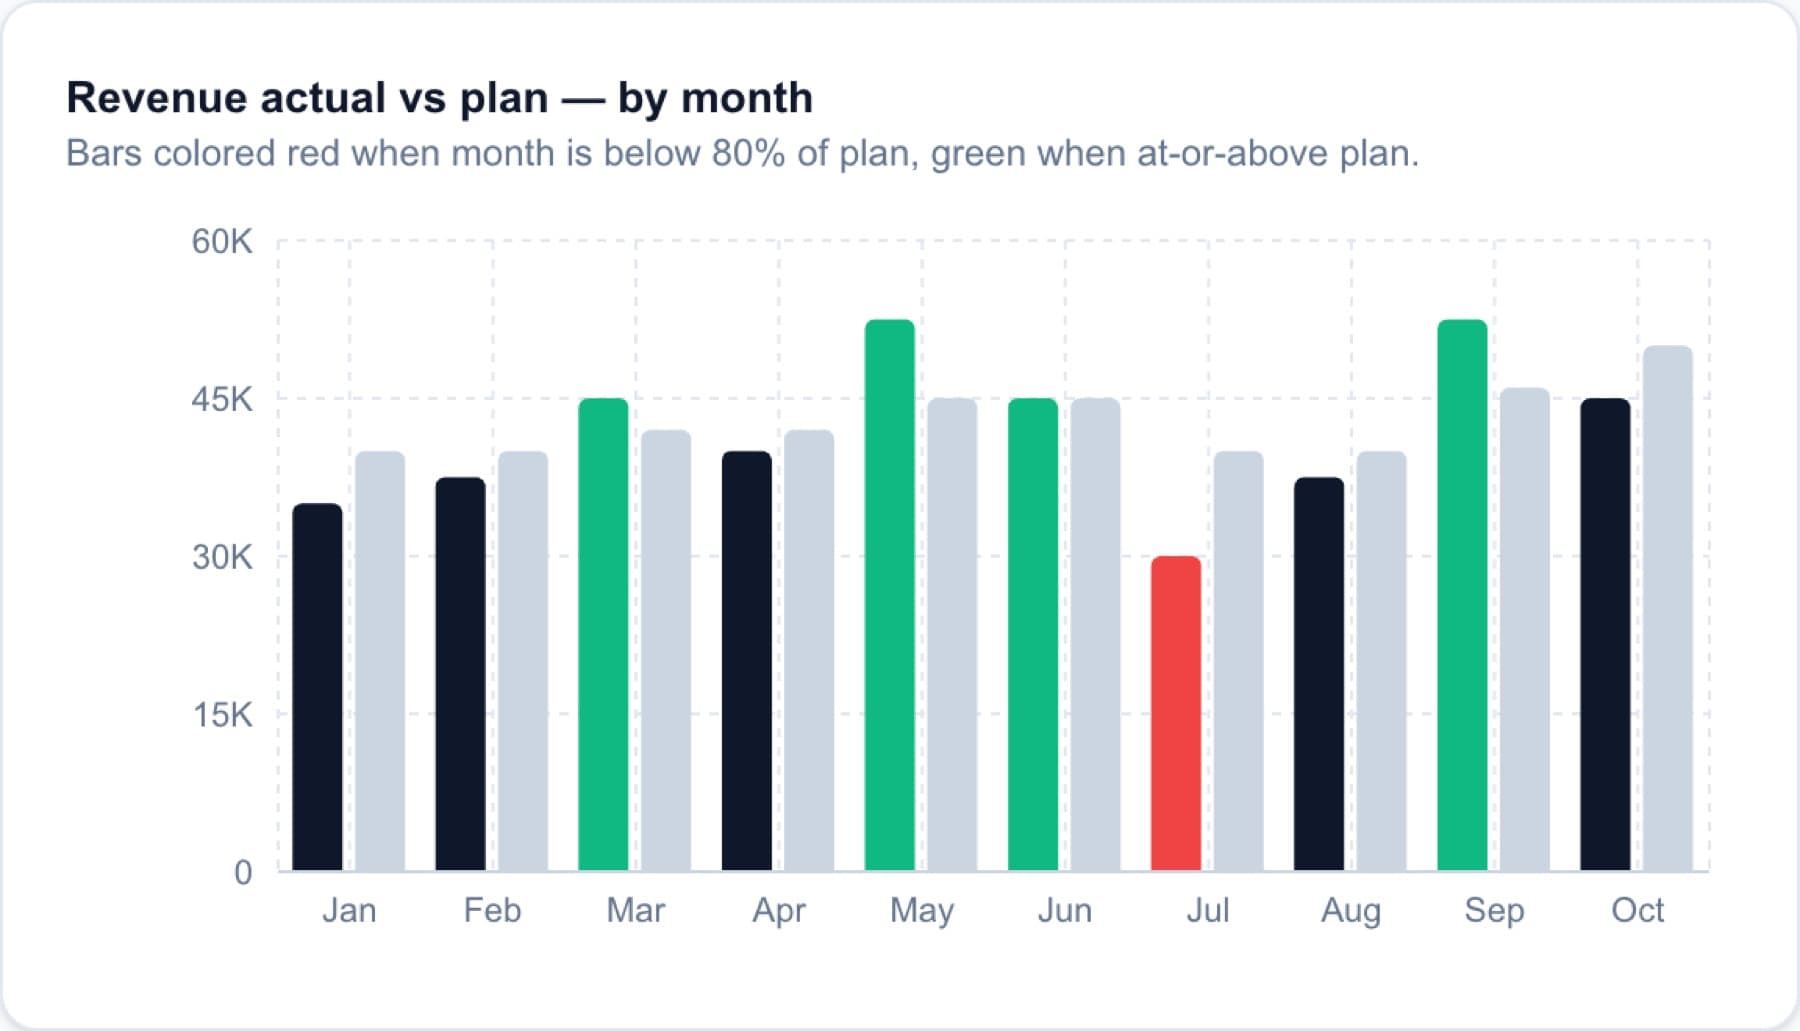
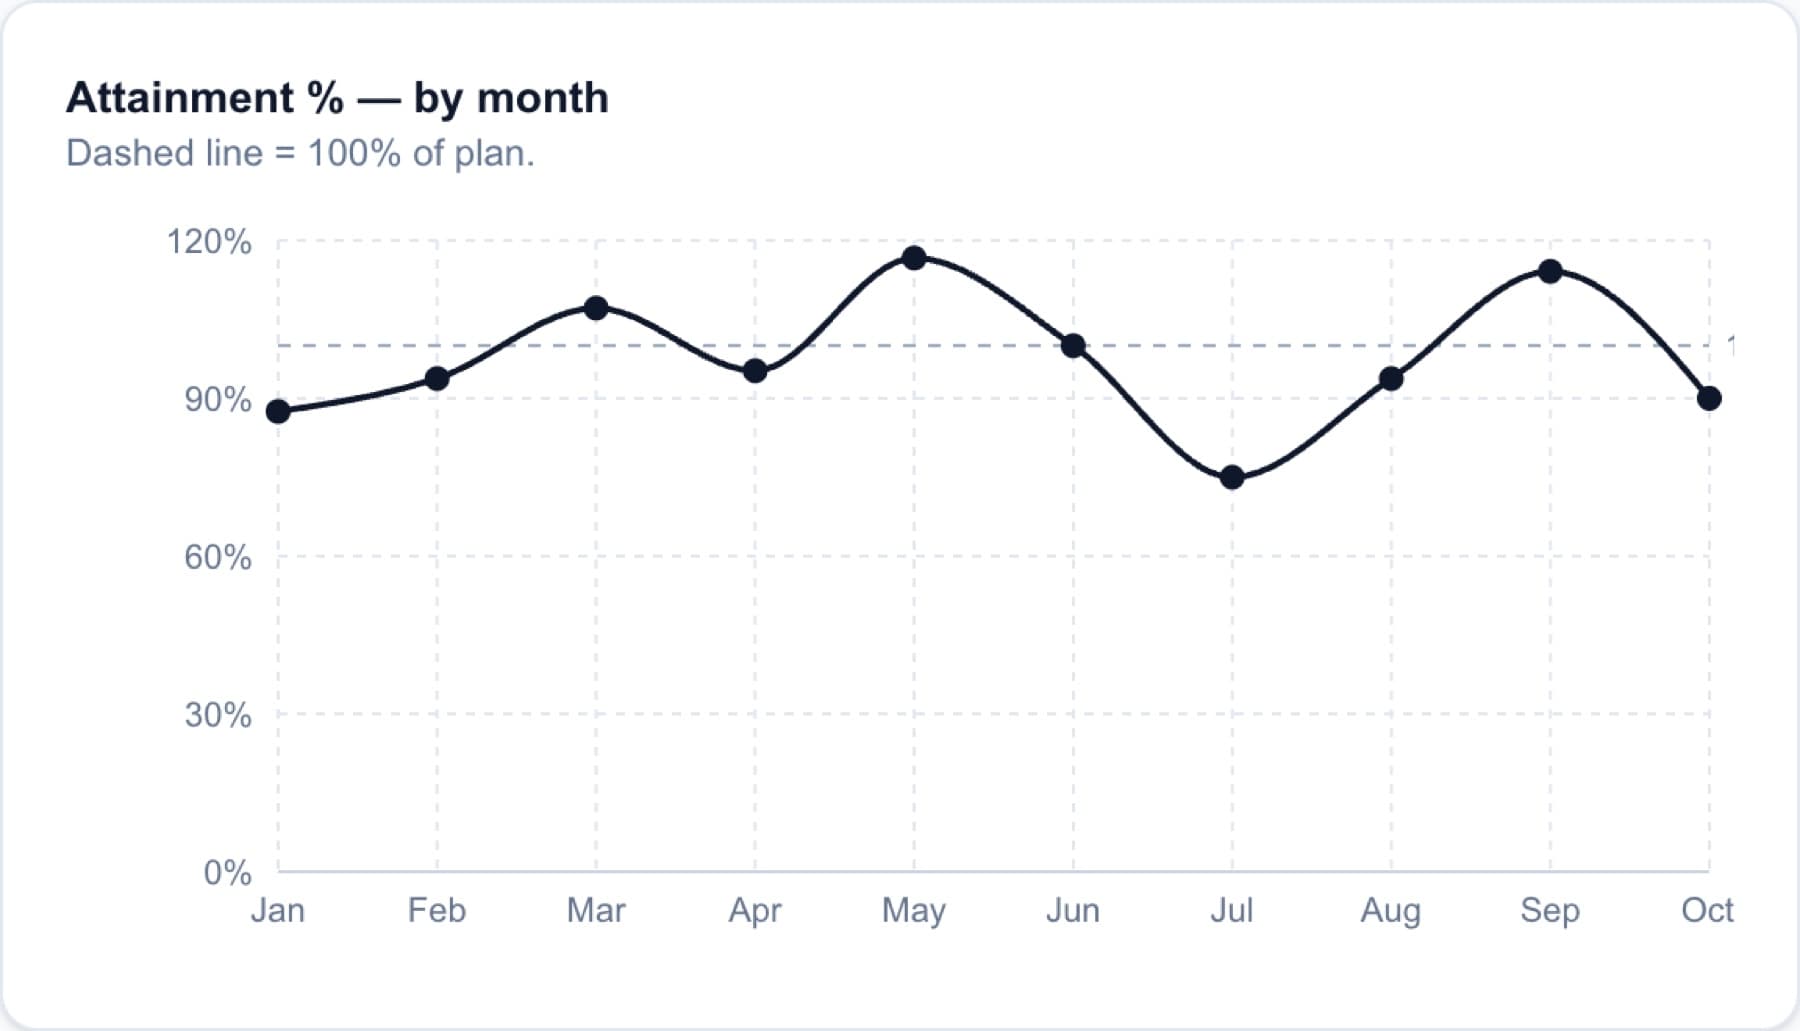
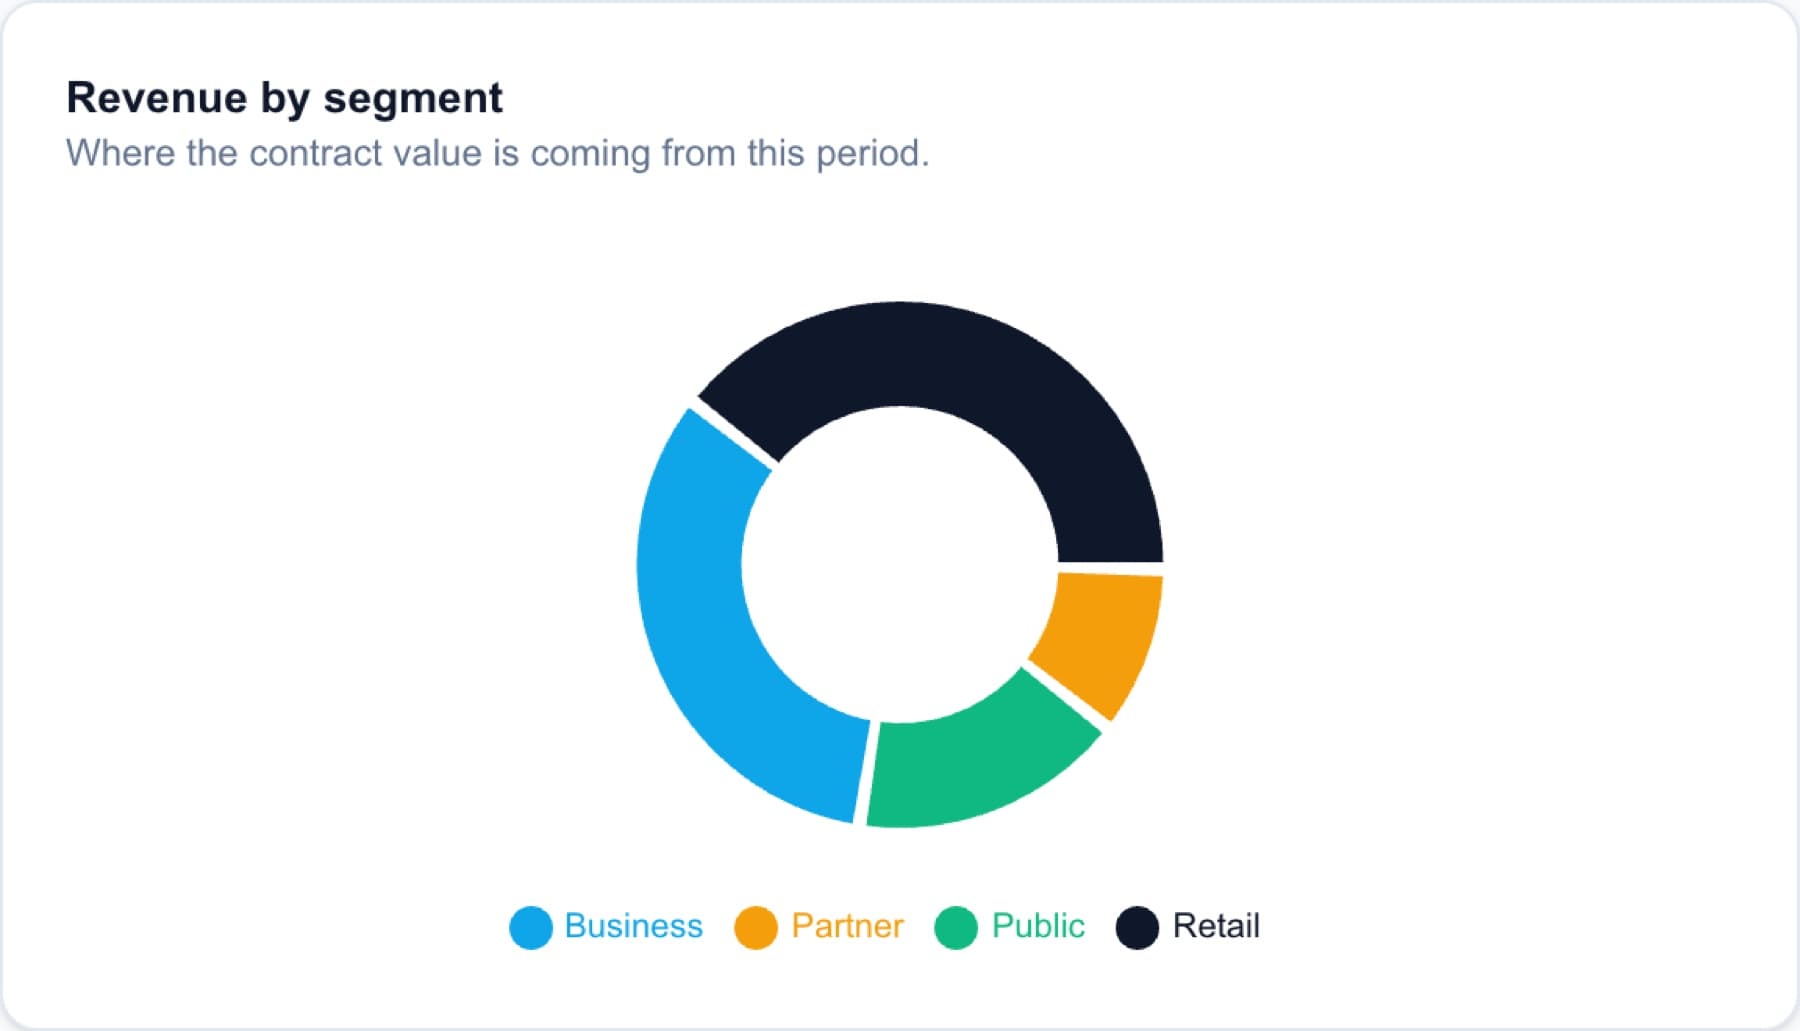
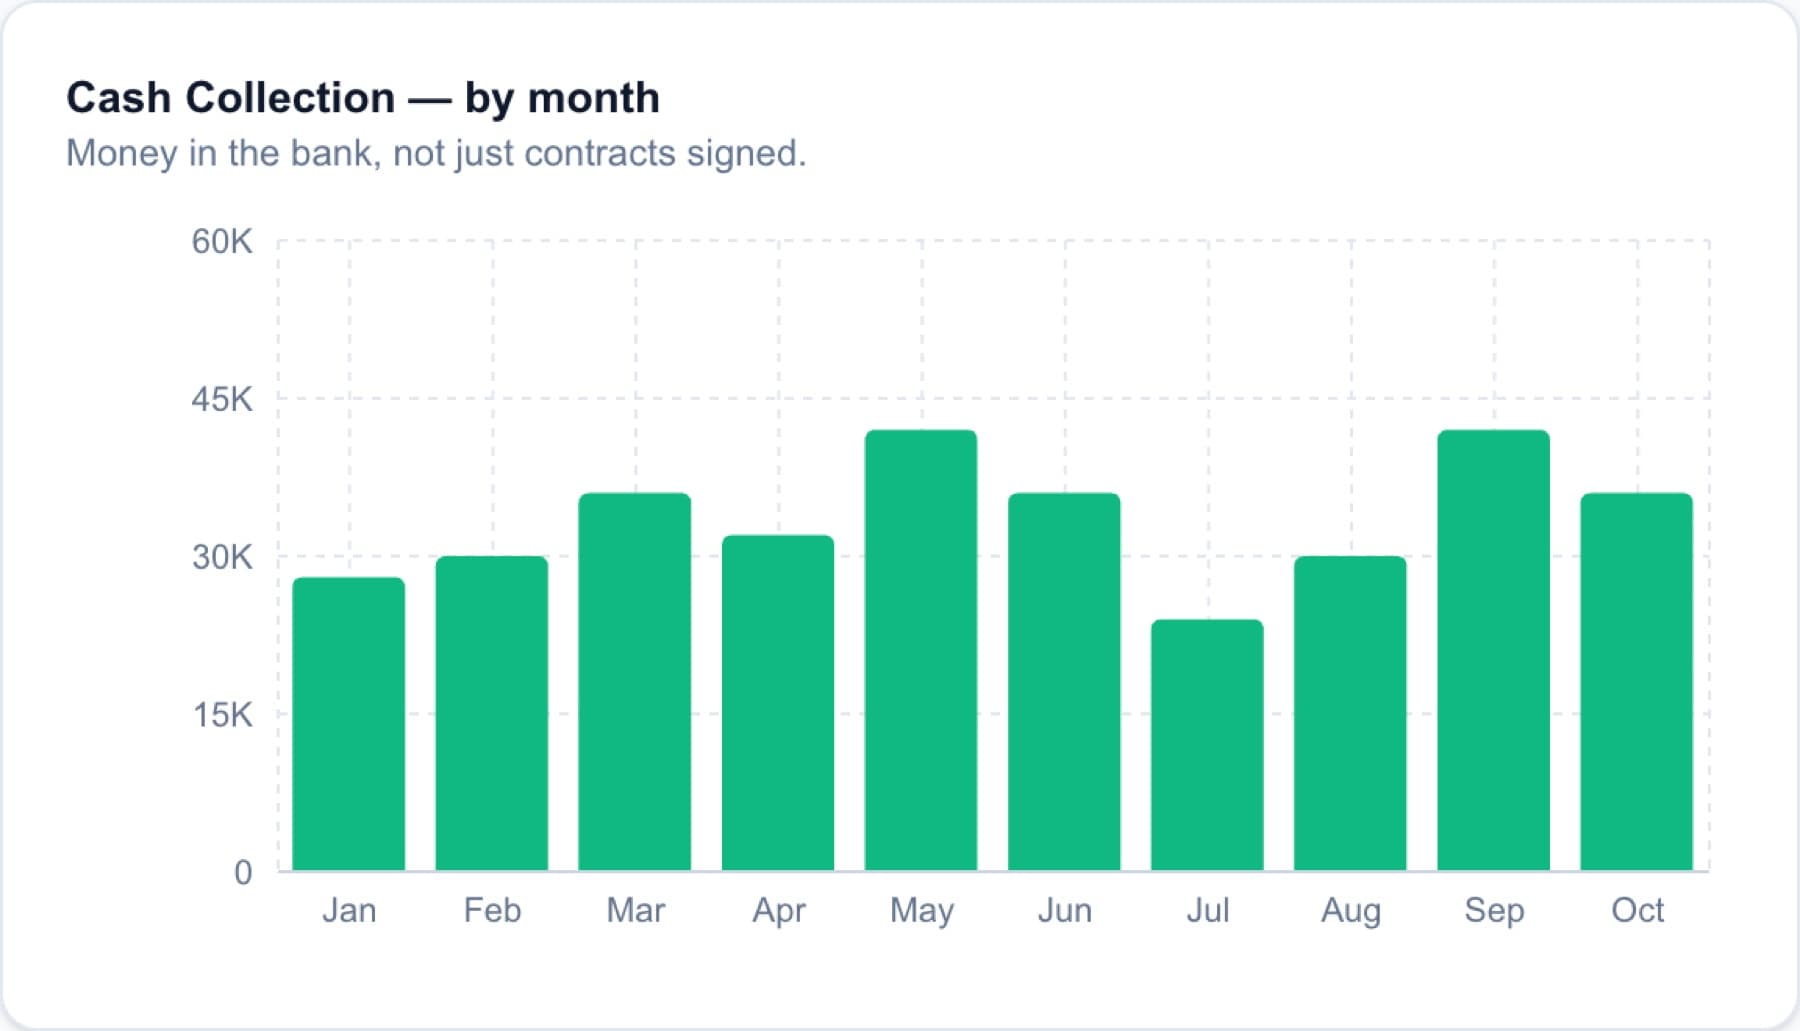
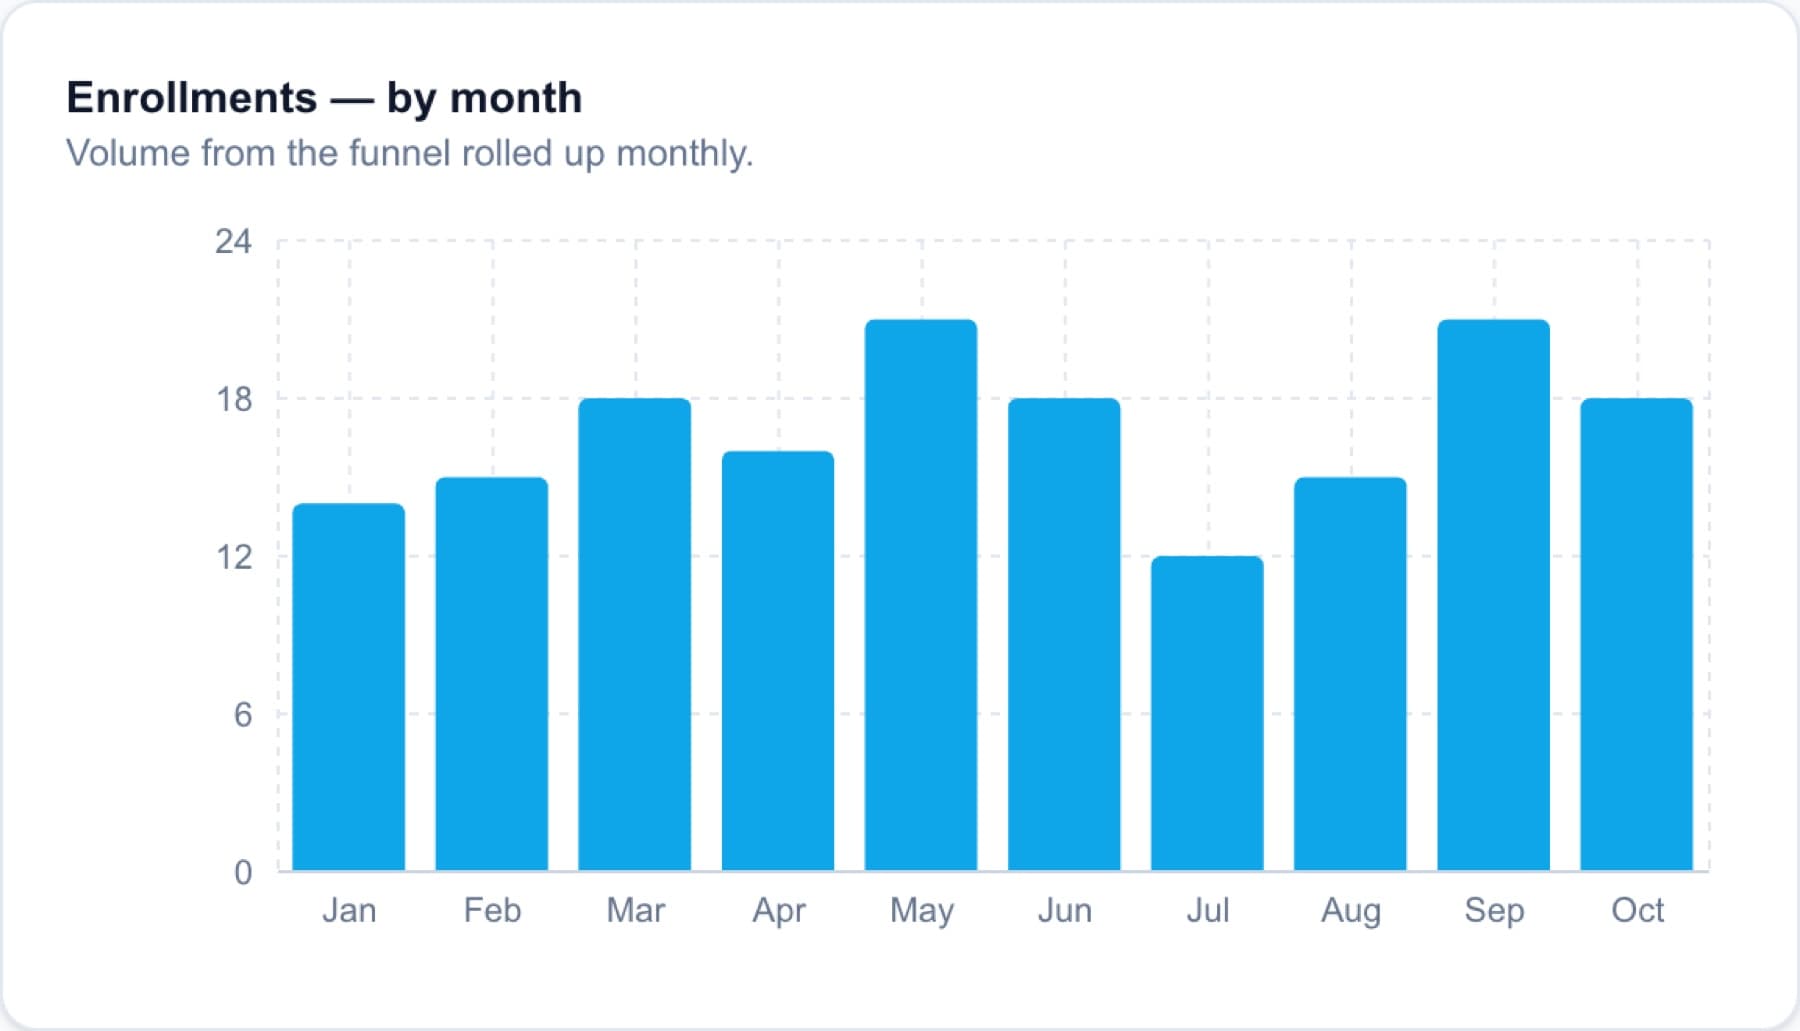
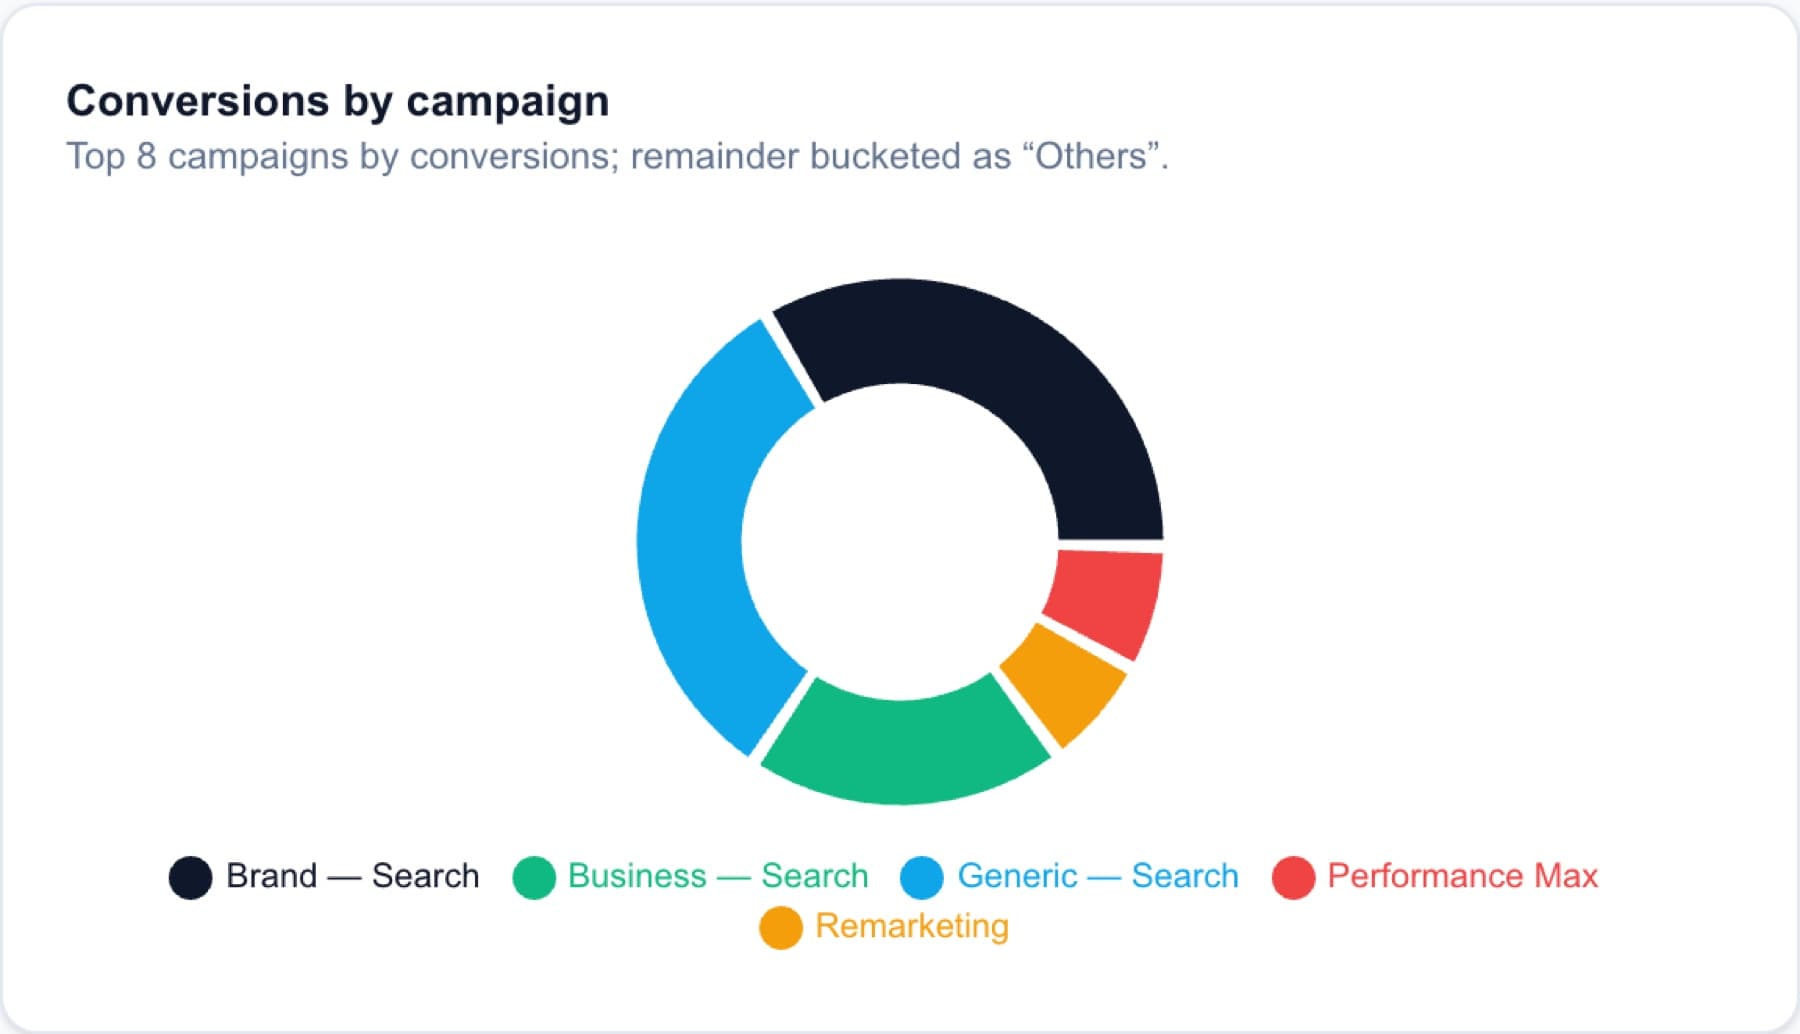
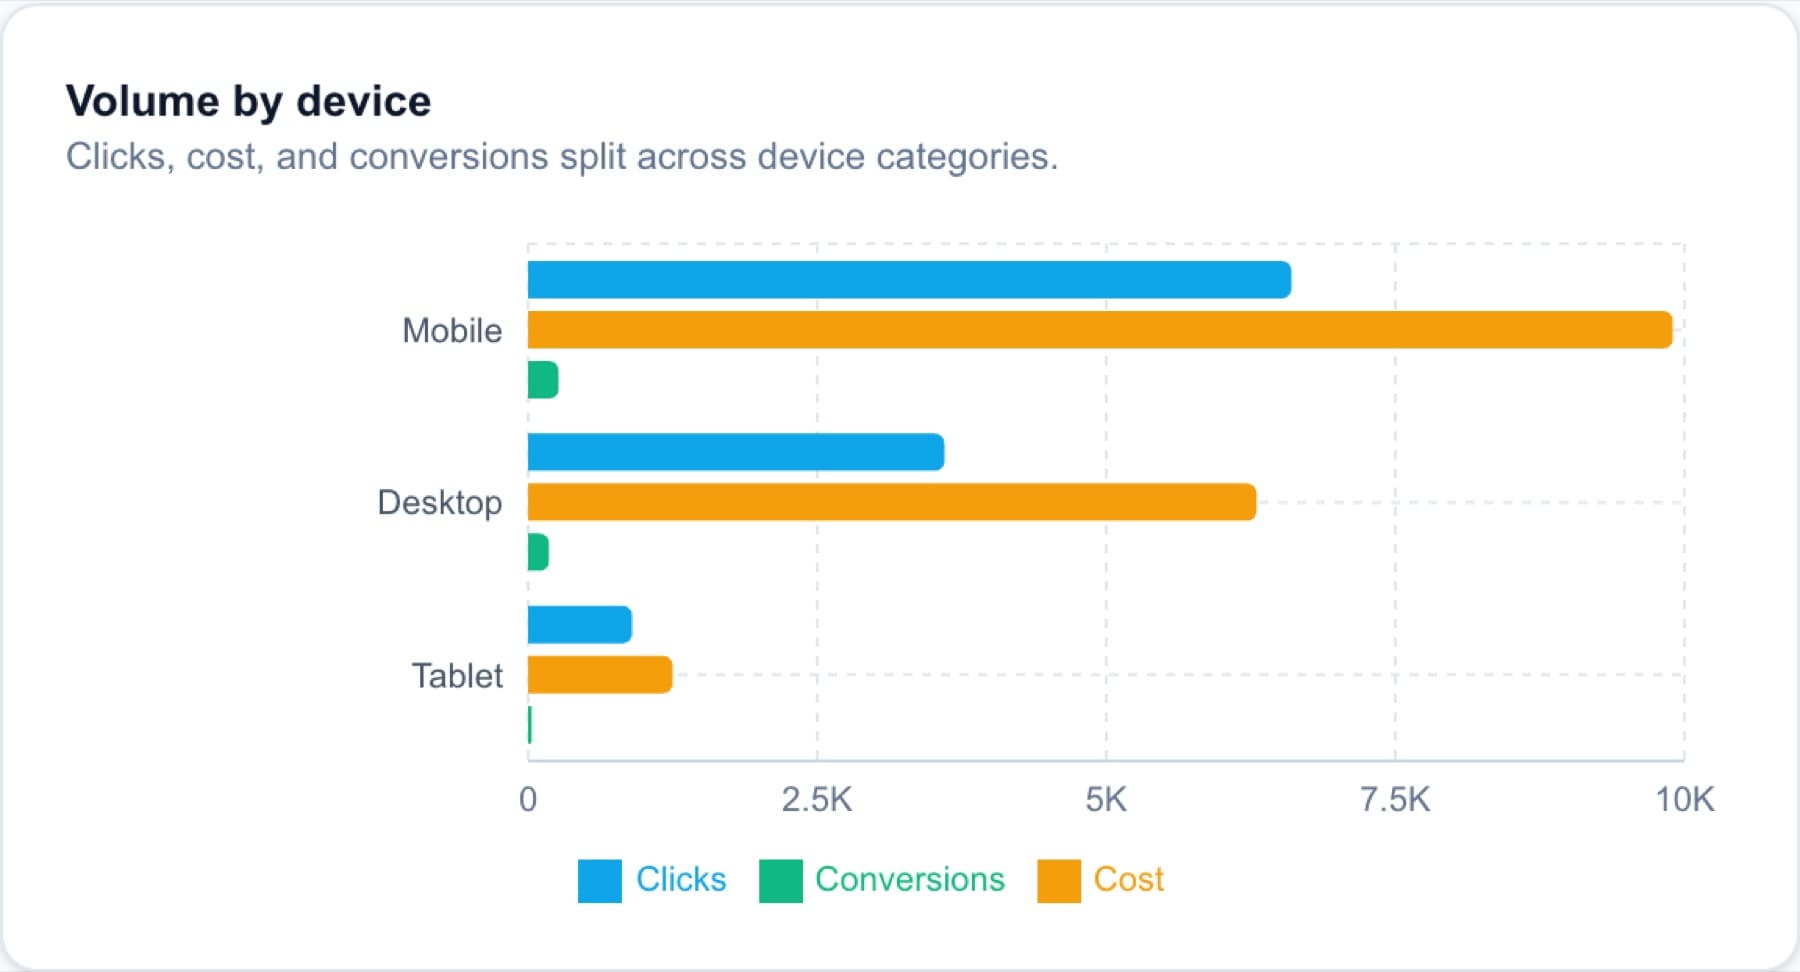
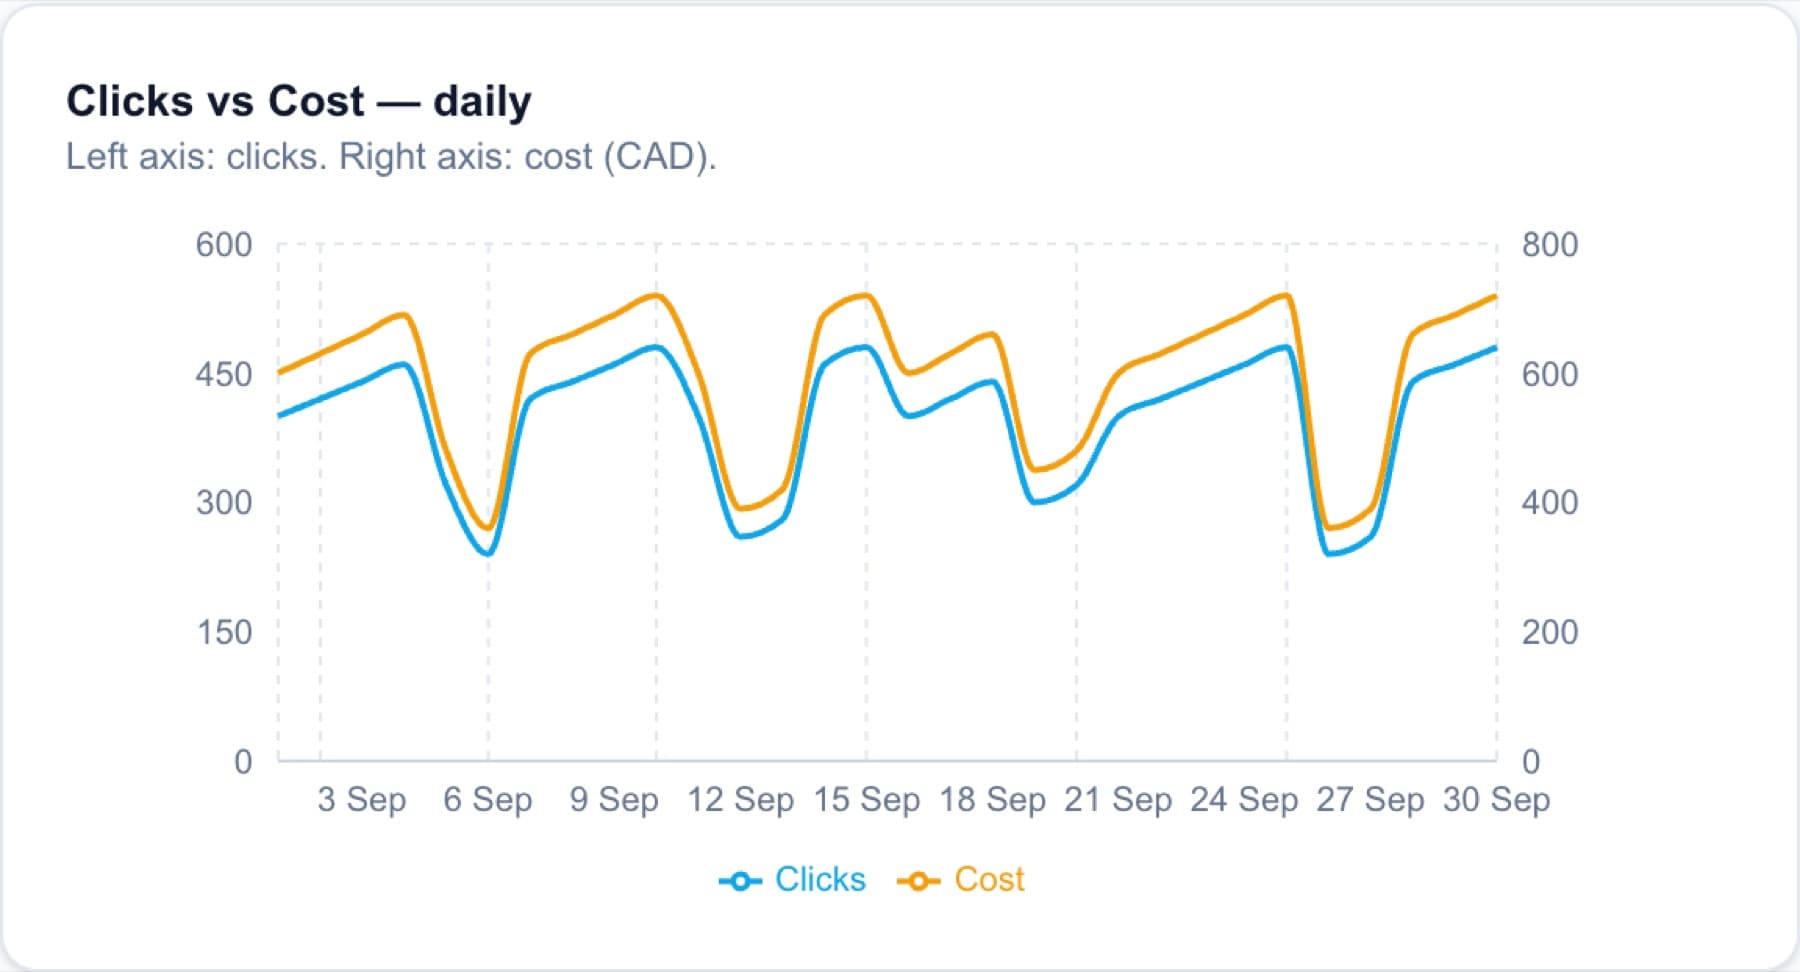
Every chart above is the starter running unconnected, on its fictional tenant, Northwind Learning. The regions, segments, product codes and numbers are invented and internally consistent so the charts have shape; they are nobody’s results. Point the starter at a Supabase project and the same components draw real data.
The work
The results
What is in the starter
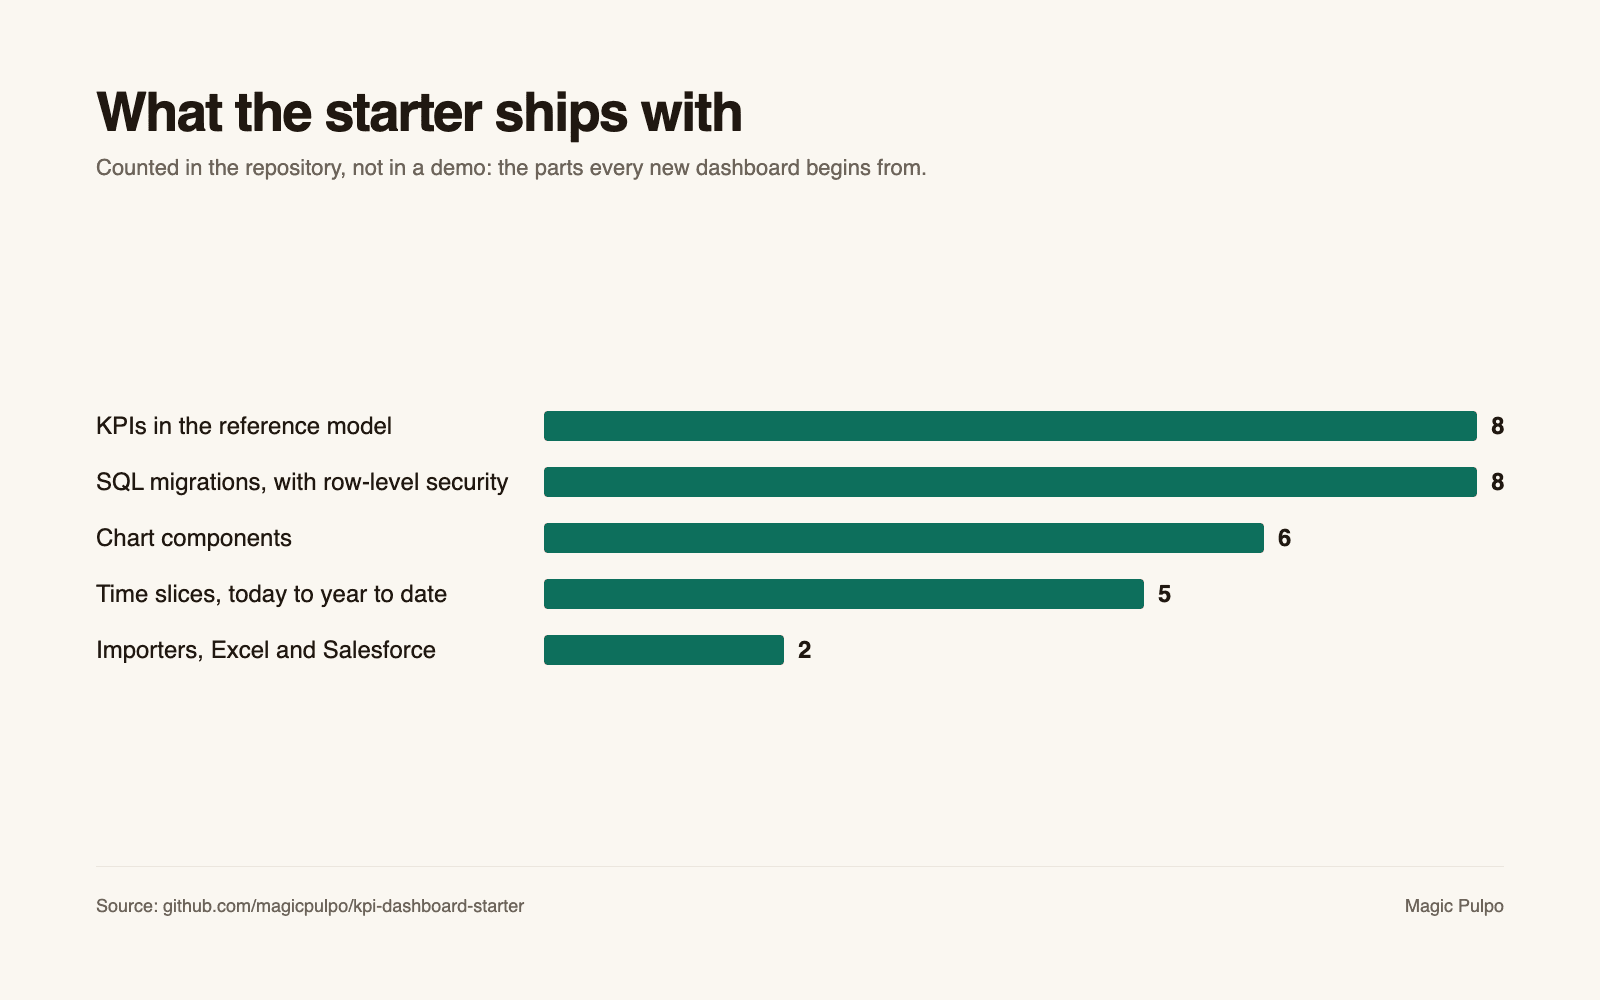
8
KPIs in the reference model
6
Chart components
5
Time slices, today to year to date
8
SQL migrations with row-level security
The starter is open on GitHub. Its reference model carries eight KPIs across funnel, revenue against plan, units, spend and reconciliation, drawn by six chart components over five time slices, on eight migrations with row-level security and period locks, fed by Excel and Salesforce importers with unit tests. No client data ships with it: every number in the demo is sample data.
What we delivered
- Config-driven KPI engine: funnel, revenue actual and plan, units, spend, reconciliation
- Six chart components plus KPI tiles, filters and an app shell
- Importers for Excel and Salesforce exports, with unit tests
- Eight SQL migrations with row-level security and period locks
- Auth and permissions layer, tested
Stack
Next.js 16
App Router, React 19
Supabase
Postgres, RLS, SSR auth
Tailwind 4
with a token layer
Recharts
chart components
Zod + Vitest
validated imports, tested logic
Related projects
All work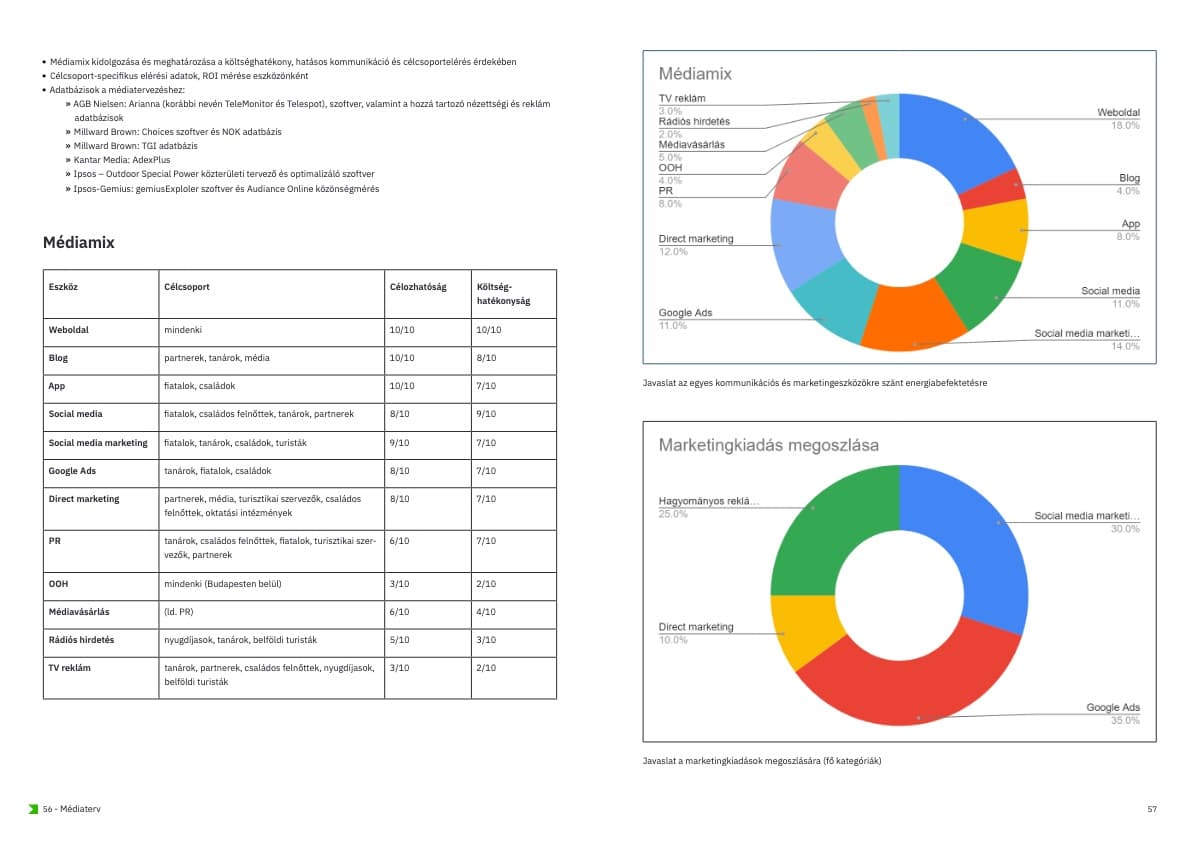
We apply the same thinking to every engagement.
Book a 30-minute strategy call. We'll look at your challenge and say whether we're the team for it.